4,068 posters, 219 videos, 101 topics, 69 sessions, 14,365 authors, 6,128 institutions
ePostersLive by SciGen Technologies S.A. All rights reserved.
Alzheimer's Association International Conference 2026
July 12-15, 2026 | London, United Kingdom, and Online

4444
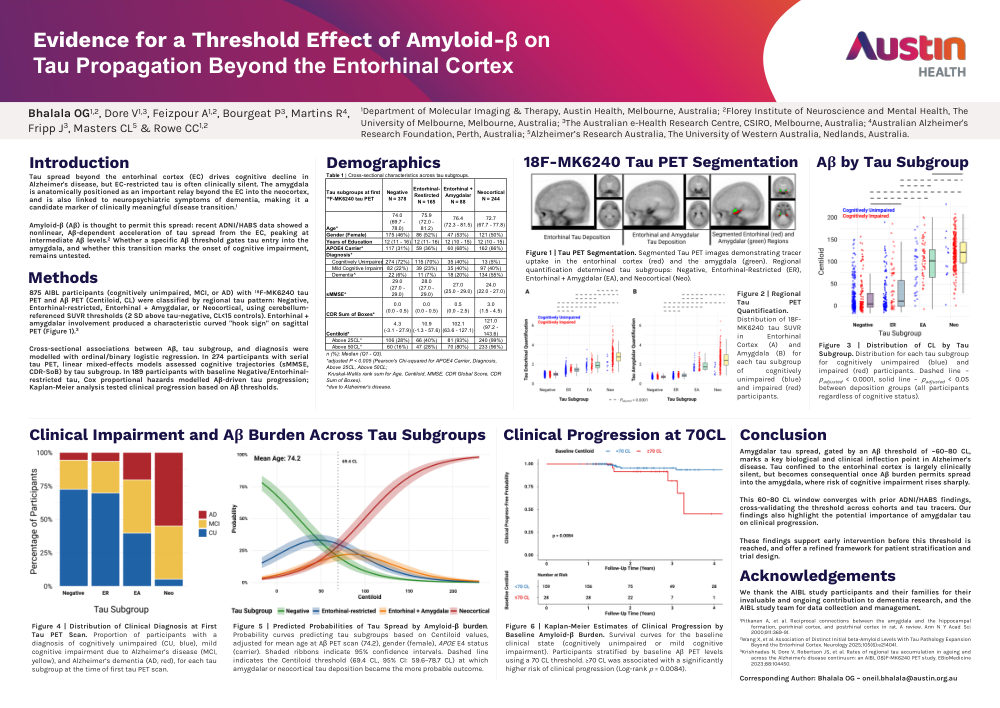
Evidence For A Threshold Effect Of Amyloid-β On Tau Propagation Beyond The Entorhinal Cortex
Poster Presenter
Authors
Affiliations
Part of Topic
Evidence for a Threshold Effect of Amyloid-β on
Tau Propagation Beyond the Entorhinal Cortex
Bhalala OG
1,2
, Dore V
1,3
, Feizpour A
1,2
, Bourgeat P
3
, Martins R
1
4
Department of Molecular Imaging & Therapy, Austin Health, Melbourne, Australia;
,
2
Florey Institute of Neuroscience and Mental Health, The
University of Melbourne, Melbourne, Australia;
Fripp J
3
, Masters CL
5
& Rowe CC
1,2
3
The Australian e-Health Research Centre, CSIRO, Melbourne, Australia;
4
Australian Alzheimer's
Research Foundation, Perth, Australia;
5
Alzheimer’s Research Australia, The University of Western Australia, Nedlands, Australia.
Introduction
Demographics
18F-MK6240 Tau PET Segmentation
Aβ by Tau Subgroup
Tau spread beyond the entorhinal cortex (EC) drives cognitive decline in
Alzheimer's disease, but EC-restricted tau is often clinically silent. The amygdala
is anatomically positioned as an important relay beyond the EC into the neocortex,
and is also linked to neuropsychiatric symptoms of dementia, making it a
candidate marker of clinically meaningful disease transition.
1
Amyloid-β (Aβ) is thought to permit this spread: recent ADNI/HABS data showed a
nonlinear, Aβ-dependent acceleration of tau spread from the EC, peaking at
intermediate Aβ levels.
2
Whether a specific Aβ threshold gates tau entry into the
amygdala, and whether this transition marks the onset of cognitive impairment,
remains untested.
Figure 1 | Tau PET Segmentation. Segmented Tau PET images demonstrating tracer
uptake in the entorhinal cortex (red) and the amygdala (green). Regional
quantification determined tau subgroups: Negative, Entorhinal-Restricted (ER),
Entorhinal + Amygdalar (EA), and Neocortical (Neo).
Methods
875 AIBL participants (cognitively unimpaired, MCI, or AD) with ¹⁸F-MK6240 tau
PET and Aβ PET (Centiloid, CL) were classified by regional tau pattern: Negative,
Entorhinal-restricted, Entorhinal + Amygdalar, or Neocortical, using cerebellumreferenced
SUVR
thresholds
(2
SD
above
tau-negative,
CL<15
controls).
Entorhinal
+
amygdalar
involvement produced a characteristic curved "hook sign" on sagittal
PET (Figure 1).
Figure 2 | Regional
Tau
PET
3
Quantification.
Distribution of 18FMK6240
tau SUVR
in
Cross-sectional associations between Aβ, tau subgroup, and diagnosis were
modelled with ordinal/binary logistic regression. In 274 participants with serial
tau PET, linear mixed-effects models assessed cognitive trajectories (sMMSE,
CDR-SoB) by tau subgroup. In 189 participants with baseline Negative/Entorhinalrestricted
tau, Cox proportional hazards modelled Aβ-driven tau progression;
Kaplan-Meier analysis tested clinical progression based on Aβ thresholds.
Entorhinal
Cortex (A) and
Amygdala (B) for
each tau subgroup
of
cognitively
unimpaired (blue)
and impaired (red)
participants.
Clinical Impairment and Aβ Burden Across Tau Subgroups
Clinical Progression at 70CL
Conclusion
Amygdalar tau spread, gated by an Aβ threshold of ~60–80 CL,
marks a key biological and clinical inflection point in Alzheimer's
disease. Tau confined to the entorhinal cortex is largely clinically
silent, but becomes consequential once Aβ burden permits spread
into the amygdala, where risk of cognitive impairment rises sharply.
This 60–80 CL window converges with prior ADNI/HABS findings,
cross-validating the threshold across cohorts and tau tracers. Our
findings also highlight the potential importance of amygdalar tau
on clinical progression.
Figure 4 | Distribution of Clinical Diagnosis at First
Tau PET Scan. Proportion of participants with a
diagnosis of cognitively unimpaired (CU, blue), mild
cognitive impairment due to Alzheimer’s disease (MCI,
yellow), and Alzheimer’s dementia (AD, red), for each tau
subgroup at the time of first tau PET scan.
Figure 5 | Predicted Probabilities of Tau Spread by Amyloid-β burden.
Probability curves predicting tau subgroups based on Centiloid values,
adjusted for mean age at Aβ PET scan (74.2), gender (female), APOE E4 status
(carrier). Shaded ribbons indicate 95% confidence intervals. Dashed line
indicates the Centiloid threshold (69.4 CL, 95% CI: 59.6–78.7 CL) at which
amygdalar or neocortical tau deposition became the more probable outcome.
Figure 6 | Kaplan-Meier Estimates of Clinical Progression by
Baseline Amyloid-β Burden. Survival curves for the baseline
clinical state (cognitively unimpaired or mild cognitive
impairment). Participants stratified by baseline Aβ PET levels
using a 70 CL threshold. ≥70 CL was associated with a significantly
higher risk of clinical progression (Log-rank p = 0.0084).
These findings support early intervention before this threshold is
reached, and offer a refined framework for patient stratification and
trial design.
Table 1 | Cross-sectional characteristics across tau subgroups.
Tau subgroups at first
¹⁸F-MK6240 tau PET
Negative
N = 378
EntorhinalRestircted
N
=
165
Entorhinal +
Amygdalar
N = 88
Neocortical
N = 244
Age*
74.0
(69.7 -
78.0)
75.9
(72.0 -
81.2)
76.4
(72.3 - 81.5)
72.7
(67.7 - 77.8)
Gender (Female)
175 (46%) 86 (52%) 47 (53%) 121 (50%)
Years of Education
12 (11 - 16) 12 (11- 16) 12 (10 - 15) 12 (10 - 15)
APOE4 Carrier*
117 (31%) 59 (36%) 60 (68%) 162 (66%)
Diagnosis*
Cognitively Unimpaired 274 (72%) 115 (70%) 35 (40%)
13 (5%)
Mild Cognitive Impairment^82 (22%) 39 (23%) 35 (40%)
97 (40%)
Dementia^
22 (6%) 11 (7%)
18 (20%) 134 (55%)
29.0
28.0
27.0
24.0
sMMSE*
(27.0 -
29.0)
(27.0 -
29.0)
(25.0 - 29.0)
(22.0 - 27.0)
0.0
0.0
0.5
3.0
(0.0 - 0.5)
(0.0 - 0.5)
(0.0 - 2.5)
(1.5 - 4.5)
CDR Sum of Boxes*
4.3
10.9
102.1
(-3.1 - 27.9)
(-1.3 - 57.6)
(63.6 - 127.1)
Centiloid*
121.0
(97.2 -
143.6)
Above 25CL*
106 (28%) 66 (40%) 81 (93%) 240 (99%)
Above 50CL*
60 (16%) 47 (28%) 70 (80%) 233 (96%)
n (%); Median (Q1 - Q3).
Figure 3 | Distribution of CL by Tau
Subgroup. Distribution for each tau subgroup
for cognitively unimpaired (blue) and
impaired (red) participants. Dashed line –
*adjusted P < 0.005 (Pearson's Chi-squared for APOE4 Carrier, Diagnosis,
Above 25CL, Above 50CL;
Kruskal-Wallis rank sum for Age, Centiloid, MMSE, CDR Global Score, CDR
Sum of Boxes).
^due to Alzheimer's disease.
padjusted < 0.0001, solid line – padjusted < 0.05
between deposition groups (all participants
regardless of cognitive status).
Acknowledgements
We thank the AIBL study participants and their families for their
invaluable and ongoing contribution to dementia research, and the
AIBL study team for data collection and management.
1
Pitkanen A, et al. Reciprocal connections between the amygdala and the hippocampal
formation, perirhinal cortex, and postrhinal cortex in rat. A review. Ann N Y Acad Sci
2000;911:369-91.
2
Wang X, et al. Association of Distinct Initial beta-Amyloid Levels With Tau Pathology Expansion
Beyond the Entorhinal Cortex. Neurology 2025;105(6):e214041.
3
Krishnadas N, Dore V, Robertson JS, et al. Rates of regional tau accumulation in ageing and
across the Alzheimer's disease continuum: an AIBL (18)F-MK6240 PET study. EBioMedicine
2023;88:104450.
Corresponding Author: Bhalala OG ~ oneil.bhalala@austin.org.au
Comments
Email is required but is not shown publicly.
Loading comments...