4,068 posters, 219 videos, 101 topics, 69 sessions, 14,365 authors, 6,128 institutions
ePostersLive by SciGen Technologies S.A. All rights reserved.
Alzheimer's Association International Conference 2026
July 12-15, 2026 | London, United Kingdom, and Online

10680
Metabolic Imaging Of The Default Mode Network In Neurodegenerative Disorders Provides A Novel Network-based Framework
Poster Presenter
Part of Topic
Metabolic imaging of the default mode network in neurodegenerative disorders provides a novel network-based framework
Background
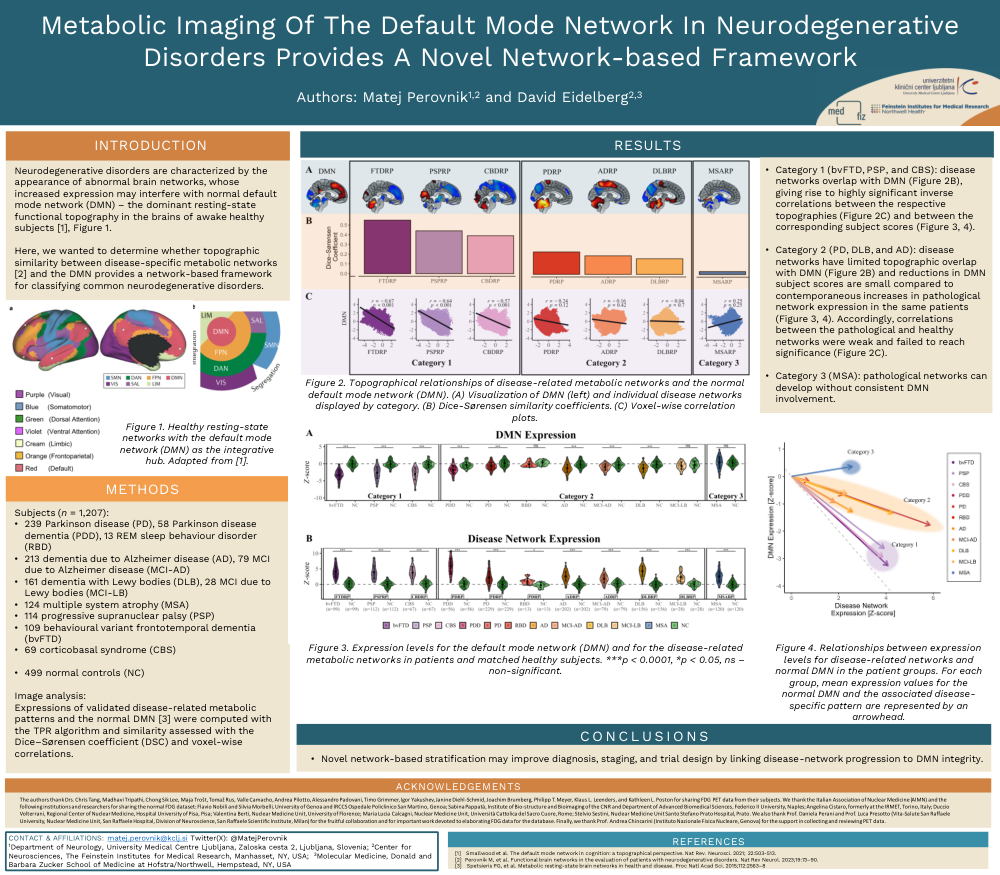
Neurodegenerative disorders are characterized by the appearance of abnormal brain networks, whose increased expression may interfere with normal default mode network (DMN) – the dominant resting-state functional topography in the brains of awake healthy subjects. It is not known to what degree these networks overlap. We wanted to determine whether topographic similarity between disease-specific metabolic networks and the DMN provides a network-based framework for classifying common neurodegenerative disorders.
Methods
Multicenter FDG PET data from 1207 patients with dementia due to Alzheimer disease (AD), mild cognitive impairment due to Alzheimer disease (MCI-AD), dementia with Lewy bodies (DLB), mild cognitive impairment with Lewy bodies (MCI-LB), Parkinson disease dementia (PDD), Parkinson disease (PD), isolated REM sleep behaviour disorder (RBD), multiple system atrophy (MSA), progressive supranuclear palsy (PSP), behavioural variant of frontotemporal dementia (bvFTD), and corticobasal syndrome (CBS), alongside 499 healthy controls was analyzed. Expressions of validated disease‑related metabolic patterns and the normal DMN were computed and similarity assessed with the Dice–Sørensen coefficient (DSC) and voxel-wise correlations. Subject scores were correlated and compared to normative data.
Results
bvFTD (DSC: 0.55), PSP (DSC: 0.44), and CBS (DSC: 0.39) disease-specific topographies and DMN showed significant overlap with a strong inverse relation in individual subject scores. PD (DSC: 0.23), AD (DSC: 0.19), and DLB (DSC: 0.16) disease-specific topographies and DMN showed less prominent overlap, with a moderate inverse relation in individual subject scores in manifest and prodromal disease. MSA (DSC: 0.03) disease-specific topography did not overlap with DMN topography, and there was no evidence of DMN disruption.
Conclusion
The results showed that the major neurodegenerative disorders can be stratified into three distinct disease categories, based on their topographic overlap with the DMN. In Category 1 (bvFTD, PSP, CBS) the disease-specific networks overlap closely with the normal DMN. In Category 2 (AD, PD, DLB, and their prodromal stages) disease-related network topographies were already established in prodromal individuals without significant DMN involvement. In Category 3 (MSA) pathological networks developed without consistent DMN involvement. This network-based stratification may improve diagnosis, staging, and trial design by linking disease-network progression to DMN integrity.
Comments
Email is required but is not shown publicly.
Loading comments...