4,068 posters, 219 videos, 101 topics, 69 sessions, 14,365 authors, 6,128 institutions
ePostersLive by SciGen Technologies S.A. All rights reserved.
Alzheimer's Association International Conference 2026
July 12-15, 2026 | London, United Kingdom, and Online

13915
Priorizing Biomarkers And Clinical Targets In Alzheimer's Disease Using A Knowledge Graph-based Semantic Framework
Poster Presenter
Authors
Part of Topic
Biomarkers -> Biomarkers (non-neuroimaging) -> Novel biomarkers
Video
A knowledge graph is powerful — but on its own, it tells us what exists, not where to go. It is like having a map of the world without a compass.
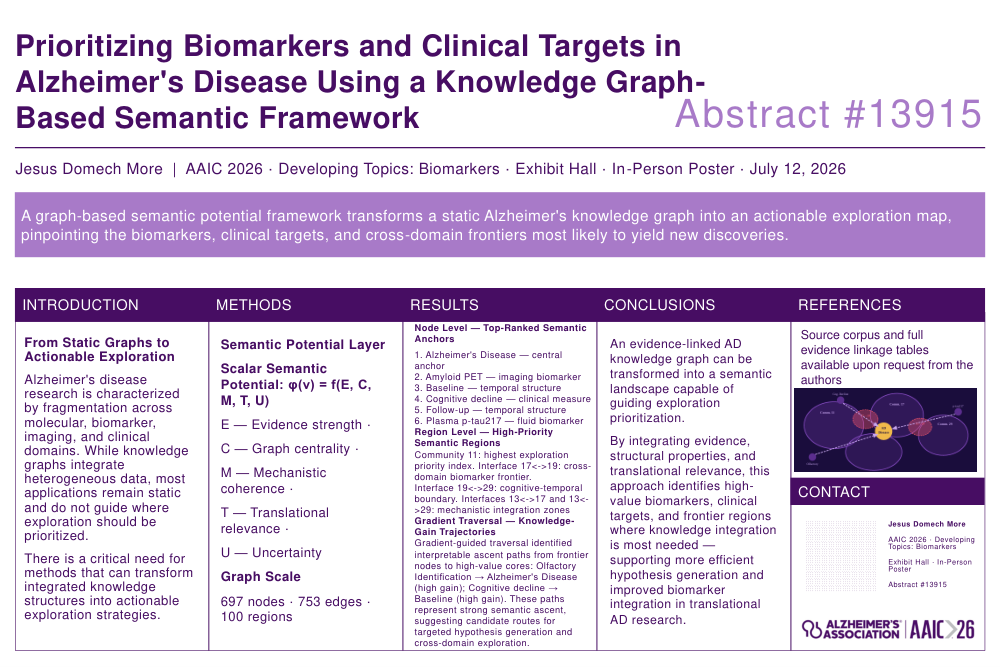
What we did in this work was give the graph a compass. We developed a semantic potential layer — a scalar function assigned to each node — integrating five dimensions: evidence strength, graph centrality, mechanistic coherence, translational relevance, and uncertainty.
This function transforms the graph into a semantic landscape — with high-value peaks and lower-priority valleys. We also computed the discrete gradient between neighboring nodes — telling us in which direction knowledge grows fastest — and neighborhood curvature, capturing the second-order structure of the landscape.
The graph we analyzed contains 697 nodes, 753 edges, and 100 regions. Regions were defined as graph communities and inter-community interfaces — boundary zones where distinct domains meet.
At the node level, the six highest-value semantic anchors were: Alzheimer's disease, Amyloid PET, Baseline, Cognitive decline, Follow-up, and plasma p-tau217. This reflects the central role that temporal and clinical biomarkers play in organizing the research knowledge space.
At the region level, Community 11 and four inter-community interfaces emerge as top-priority zones — indicating where cross-domain integration is most promising. And gradient-guided traversal revealed interpretable knowledge-gain paths: from Olfactory Identification to Alzheimer's Disease, and from Cognitive Decline to Baseline. These are concrete routes for targeted hypothesis generation.
This framework shows it is possible to transform a static graph into an active exploration map — one that can guide where Alzheimer's research should focus its energy.
In the next poster, we go further: we apply this approach to a much larger graph, and we will show you the platform we built to do this at scale. Thank you.
Comments
Email is required but is not shown publicly.
Loading comments...