4,068 posters, 219 videos, 101 topics, 69 sessions, 14,365 authors, 6,128 institutions
ePostersLive by SciGen Technologies S.A. All rights reserved.
Alzheimer's Association International Conference 2026
July 12-15, 2026 | London, United Kingdom, and Online

13800
Dissociable Patterns Of ATL And IFG Degeneration Distinguish TDP-C From Pick’s Disease
Poster Presenter
Part of Topic
Biomarkers -> Neuroimaging -> Differential diagnosis
INTRODUCTION
- Anterior temporal lobe (ATL) degeneration is a hallmark of several primary progressive aphasia syndromes.
- In particular, ATL atrophy is characteristic of frontotemporal lobar degeneration due to TDP-43, type C (FTLD-TDP type C, or TDP-C).
- However, Pick’s disease (PiD), a subtype of FTLD-tau, can also affect the ATL early, along with the inferior frontal gyrus (IFG).
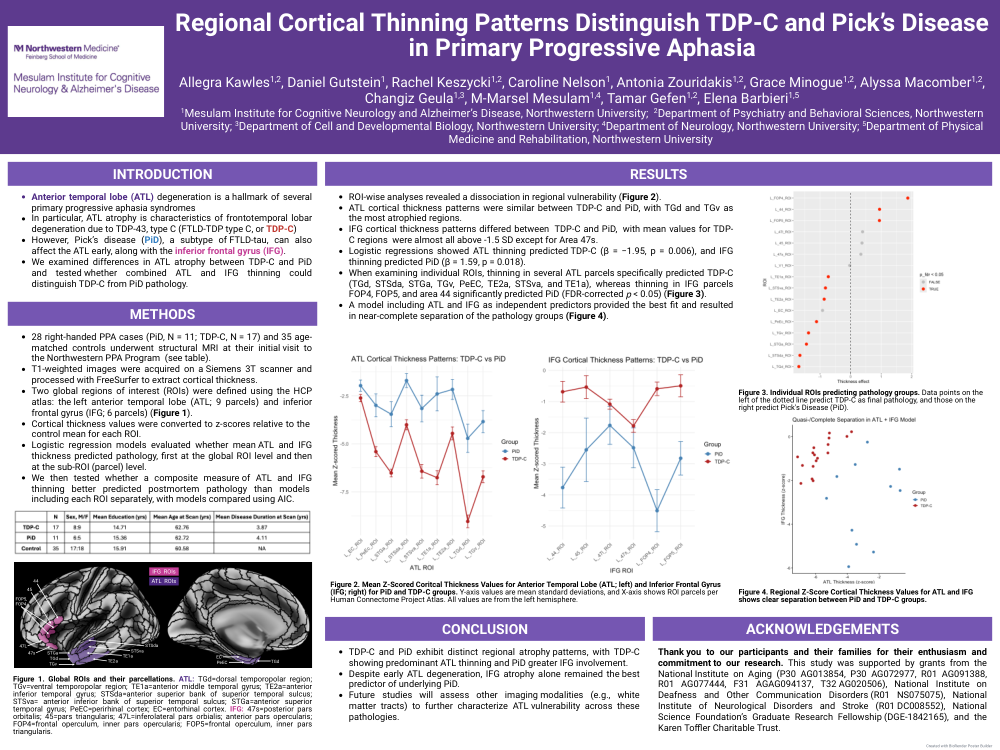
- We examined differences in ATL atrophy between TDP-C and PiD and tested whether combined ATL and IFG thinning could distinguish TDP-C from PiD pathology.
METHODS
- Twenty-eight right-handed PPA cases (PiD, N = 11; TDP-C, N = 17) and 35 age-matched controls underwent structural MRI at their initial visit to the Northwestern PPA Program.
- T1-weighted images were acquired on a Siemens 3T scanner and processed with FreeSurfer to extract cortical thickness.
- Two global regions of interest (ROIs) were defined using the Human Connectome Project (HCP) atlas:
- Left anterior temporal lobe (ATL; 9 parcels)
- Inferior frontal gyrus (IFG; 6 parcels)
- Cortical thickness values were converted to z-scores relative to the control mean for each ROI.
- Logistic regression models evaluated whether mean ATL and IFG thickness predicted pathology, first at the global ROI level and then at the sub-ROI (parcel) level.
- A composite measure of ATL and IFG thinning was compared with models including each ROI separately using Akaike Information Criterion (AIC).
RESULTS
- ROI-wise analyses revealed a dissociation in regional vulnerability (Figure 2).
- ATL cortical thickness patterns were similar between TDP-C and PiD, with TGd and TGv as the most atrophied regions.
- IFG cortical thickness patterns differed between TDP-C and PiD, with mean values for TDP-C regions almost all above −1.5 SD except for area 47s.
- Logistic regressions showed ATL thinning predicted TDP-C (β = −1.95, p = 0.006), and IFG thinning predicted PiD (β = 1.59, p = 0.018).
- Individual ROI analyses showed:
- ATL thinning in TGd, STSda, STGa, TGv, PeEC, TE2a, STSva, and TE1a predicted TDP-C.
- IFG thinning in FOP4, FOP5, and area 44 predicted PiD (FDR-corrected p < 0.05).
- A model including ATL and IFG as independent predictors provided the best fit and resulted in near-complete separation of the pathology groups.
CONCLUSION
- TDP-C and PiD exhibit distinct regional atrophy patterns, with TDP-C showing predominant ATL thinning and PiD greater IFG involvement.
- Despite early ATL degeneration, IFG atrophy alone remained the best predictor of underlying PiD.
- Future studies will assess additional imaging modalities (e.g., white matter tracts) to further characterize ATL vulnerability across these pathologies.
Comments
Email is required but is not shown publicly.
Loading comments...