4,068 posters, 219 videos, 101 topics, 69 sessions, 14,365 authors, 6,128 institutions
ePostersLive by SciGen Technologies S.A. All rights reserved.
Alzheimer's Association International Conference 2026
July 12-15, 2026 | London, United Kingdom, and Online

12846
Deviation Maps Of Diffusion MRI Enhance Visual Evidence Of Alzheimer Tissue Pathology Across Pathological And Clinical Stages
Poster Presenter
Part of Topic
Biomarkers -> Neuroimaging -> Novel imaging methods
Introduction
Markers derived from diffusion MRI (dMRI) have different biological sensitivities and have shown much promise in tracking early Alzheimer's tissue pathology [1,2]
Clinical adoption of dMRI has been limited due to the pathological image contrast being obscured by normal age-related variation and methodological artifacts
Objective: Improve the clinical readability of dMRI maps by isolating pathology-related signal using voxel-wise normative models
Methods
Datasets
UK Biobank (n=8,562 healthy participants)
ADNI 3 and 4 (338 CN, 131 MCI, 47 dementia)
Image processing
DTI and NODDI maps derived from multi-shell dMRI
All images transformed in a common template
Tissue segmentation with BISON
ComBat harmonization to UK Biobank reference [3]
Normative modelling at each voxel
Bayesian linear regression using the PCN toolkit [4]
Covariates: age, sex, tissue type, CSF partial volume effect (PVE), site
Trained on UK biobank reference, extended to ADNI
Group differences in abnormal voxels
Calculated proportion of abnormal voxels (Z>2 and Z<-2) per tissue type per subject
Associations with clinical status, amyloid PET, tau PET
Correcting for age and sex, p-values FDR corrected
Results
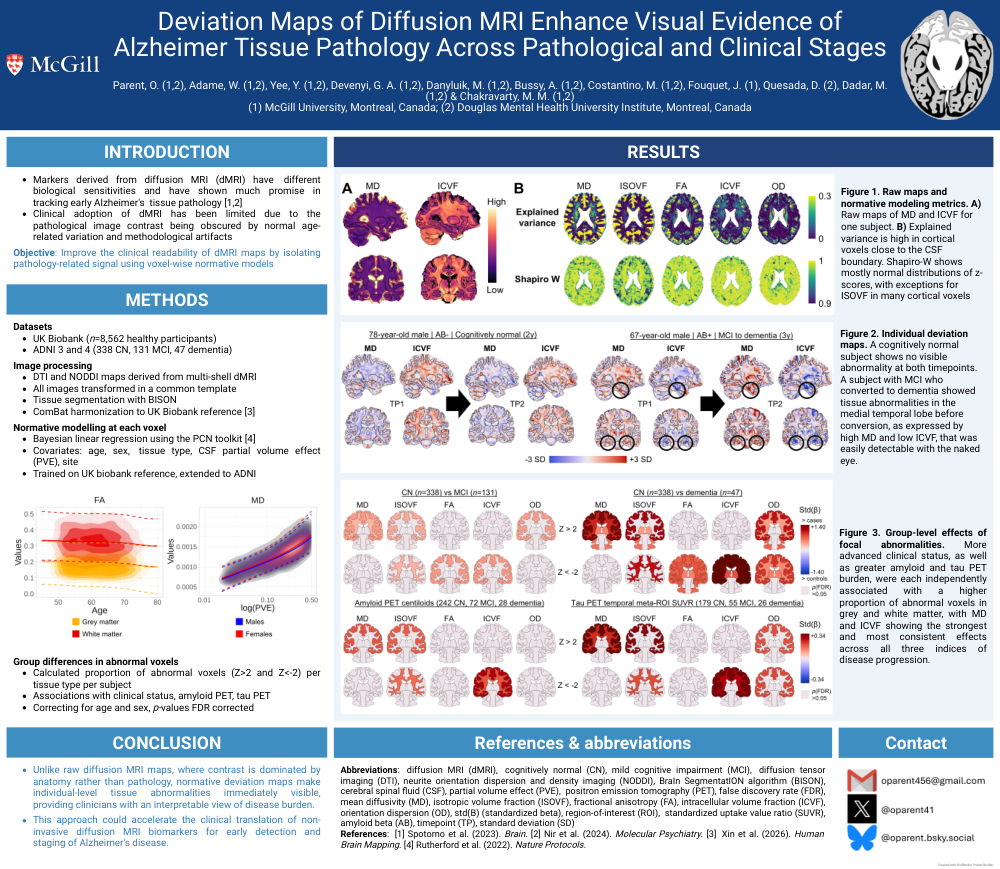
Figure 1. Raw maps and normative modeling metrics. A) Raw maps of MD and ICVF for one subject. B) Explained variance is high in cortical voxels close to the CSF boundary. Shapiro-W shows mostly normal distributions of z-scores, with exceptions for ISOVF in many cortical voxels
Figure 2.Individual deviation maps. A cognitively normal subject shows no visible abnormality at both timepoints. A subject with MCI who converted to dementia showed tissue abnormalities in the medial temporal lobe before conversion, as expressed by high MD and low ICVF, that was easily detectable with the naked eye.
Figure 3. Group-level effects of focal abnormalities. More advanced clinical status, as well as greater amyloid and tau PET burden, were each independently associated with a higher proportion of abnormal voxels in grey and white matter, with MD and ICVF showing the strongest and most consistent effects across all three indices of disease progression.
Discussion
Unlike raw diffusion MRI maps, where contrast is dominated by anatomy rather than pathology, normative deviation maps make individual-level tissue abnormalities immediately visible, providing clinicians with an interpretable view of disease burden.
This approach could accelerate the clinical translation of non-invasive diffusion MRI biomarkers for early detection and staging of Alzheimer's disease.
Abbreviations: diffusion MRI (dMRI), cognitively normal (CN), mild cognitive impairment (MCI), diffusion tensor imaging (DTI), neurite orientation dispersion and density imaging (NODDI), BraIn SegmentatION algorithm (BISON), cerebral spinal fluid (CSF), partial volume effect (PVE), positron emission tomography (PET), false discovery rate (FDR), mean diffusivity (MD), isotropic volume fraction (ISOVF), fractional anisotropy (FA), intracellular volume fraction (ICVF), orientation dispersion (OD), std(B) (standardized beta), region-of-interest (ROI), standardized uptake value ratio (SUVR), amyloid beta (AB), timepoint (TP), standard deviation (SD)
References: [1] Spotorno et al. (2023). Brain. [2] Nir et al. (2024). Molecular Psychiatry. [3] Xin et al. (2026). Human Brain Mapping. [4] Rutherford et al. (2022). Nature Protocols.
Comments
Email is required but is not shown publicly.
Loading comments...