4,068 posters, 219 videos, 101 topics, 69 sessions, 14,365 authors, 6,128 institutions
ePostersLive by SciGen Technologies S.A. All rights reserved.
Alzheimer's Association International Conference 2026
July 12-15, 2026 | London, United Kingdom, and Online

10384
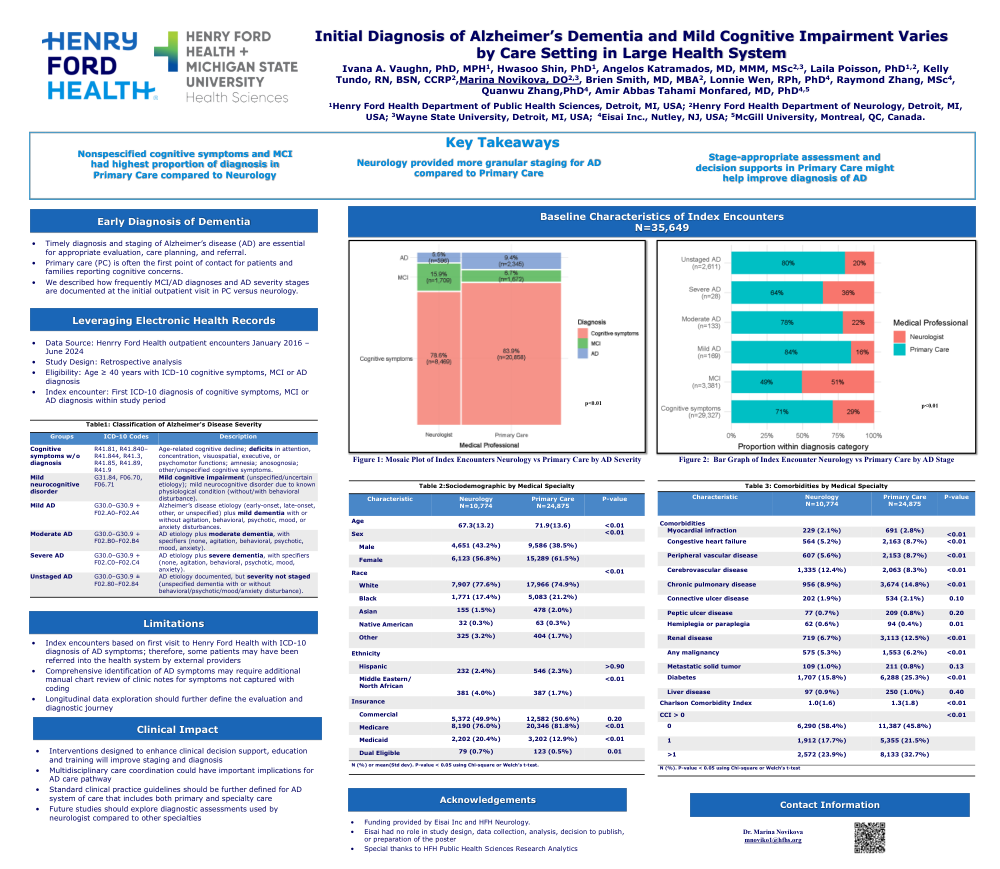
Initial Diagnosis Of Alzheimer’S Dementia (AD) And Mild Cognitive Impairment (MCI) Varies By Care Setting In A Large Health System
Poster Presenter
Authors
Ivana A. Vaughn, PhD, MPH, Hwasoo Shin, PhD, Angelos Katramados, MD, MMM, MSc, Laila Poisson, PhD, Kelly Tundo, RN, BSN, CCRP, Marina Novikova, DO, Brien Smith, MD, MBA, Lonnie Wen, RPh, PhD, Raymond Zhang, MSc, Quanwu Zhang, PhD, Amir Abbas Tahami Monfared, MD, PhD
Affiliations
Henry Ford Health System, Department of Public Health Sciences, Detroit, MI, USA, Henry Ford Health System Department of Neurology, Wayne State University, Michigan State University, Henry Ford Health System Department of Neurology, Detroit, MI, Henry Ford Health System Department of Neurology, Wayne State University,, Henry Ford Health System Department of Neurology, Michigan State University, Eisai Inc, Nutley, NJ, USA
Part of Topic
Initial Diagnosis of Alzheimer’s Dementia and Mild Cognitive Impairment Varies by Care Setting in Large Health System
Ivana A. Vaughn, PhD, MPH1, Hwasoo Shin, PhD1, Angelos Katramados, MD, MMM, MSc2,3, Laila Poisson, PhD1,2, Kelly Tundo, RN, BSN, CCRP2,Marina Novikova, DO2,3, Brien Smith, MD, MBA2, Lonnie Wen, RPh, PhD4, Raymond Zhang, MSc4, Quanwu Zhang,PhD4, Amir Abbas Tahami Monfared, MD, PhD4,5
1Henry Ford Health Department of Public Health Sciences, Detroit, MI, USA; 2Henry Ford Health Department of Neurology, Detroit, MI, USA; 3Wayne State University, Detroit, MI, USA; 4Eisai Inc., Nutley, NJ, USA; 5McGill University, Montreal, QC, Canada.
Key Takeaways
Nonspescified cognitive symptoms and MCI had highest proportion of diagnosis in Primary Care compared to Neurology
Neurology provided more granular staging for AD compared to Primary Care
Stage-appropriate assessment and decision supports in Primary Care might help improve diagnosis of AD
Early Diagnosis of Dementia
Timely diagnosis and staging of Alzheimer’s disease (AD) are essential for appropriate evaluation, care planning, and referral.
Primary care (PC) is often the first point of contact for patients and families reporting cognitive concerns.
We described how frequently MCI/AD diagnoses and AD severity stages are documented at the initial outpatient visit in PC versus neurology.
Leveraging Electronic Health Records
Data Source: Henrry Ford Health outpatient encounters January 2016 – June 2024
Study Design: Retrospective analysis
Eligibility: Age ≥ 40 years with ICD-10 cognitive symptoms, MCI or AD diagnosis
Index encounter: First ICD-10 diagnosis of cognitive symptoms, MCI or AD diagnosis within study period
|
Groups |
ICD-10 Codes |
Description |
|
Cognitive symptoms w/o diagnosis |
R41.81, R41.840–R41.844, R41.3, R41.85, R41.89, R41.9 |
Age-related cognitive decline; deficits in attention, concentration, visuospatial, executive, or psychomotor functions; amnesia; anosognosia; other/unspecified cognitive symptoms. |
|
Mild neurocognitive disorder |
G31.84, F06.70, F06.71 |
Mild cognitive impairment (unspecified/uncertain etiology); mild neurocognitive disorder due to known physiological condition (without/with behavioral disturbance). |
|
Mild AD |
G30.0–G30.9 + F02.A0–F02.A4 |
Alzheimer’s disease etiology (early-onset, late-onset, other, or unspecified) plus mild dementia with or without agitation, behavioral, psychotic, mood, or anxiety disturbances. |
|
Moderate AD |
G30.0–G30.9 + F02.B0–F02.B4 |
AD etiology plus moderate dementia, with specifiers (none, agitation, behavioral, psychotic, mood, anxiety). |
|
Severe AD |
G30.0–G30.9 + F02.C0–F02.C4 |
AD etiology plus severe dementia, with specifiers (none, agitation, behavioral, psychotic, mood, anxiety). |
|
Unstaged AD |
G30.0–G30.9 ± F02.80–F02.84 |
AD etiology documented, but severity not staged (unspecified dementia with or without behavioral/psychotic/mood/anxiety disturbance). |
Limitations
Index encounters based on first visit to Henry Ford Health with ICD-10 diagnosis of AD symptoms; therefore, some patients may have been referred into the health system by external providers
Comprehensive identification of AD symptoms may require additional manual chart review of clinic notes for symptoms not captured with coding
Longitudinal data exploration should further define the evaluation and diagnostic journey
Clinical Impact
Interventions designed to enhance clinical decision support, education and training will improve staging and diagnosis
Multidisciplinary care coordination could have important implications for AD care pathway
Standard clinical practice guidelines should be further defined for AD system of care that includes both primary and specialty care
Future studies should explore diagnostic assessments used by neurologist compared to other specialties
Figure 1: Mosaic Plot of Index Encounters Neurology vs Primary Care by AD Severity
Figure 2: Bar Graph of Index Encounter Neurology vs Primary Care by AD Stage
|
Table 2:Sociodemographic by Medical Specialty |
|||
|
Characteristic |
Neurology N=10,774 |
Primary Care N=24,875 |
P-value |
|
Age |
67.3(13.2) |
71.9(13.6) |
<0.01 |
|
Sex |
|
|
<0.01 |
|
Male |
4,651 (43.2%) |
9,586 (38.5%) |
|
|
Female |
6,123 (56.8%) |
15,289 (61.5%) |
|
|
Race |
|
|
<0.01 |
|
White |
7,907 (77.6%) |
17,966 (74.9%) |
|
|
Black |
1,771 (17.4%) |
5,083 (21.2%) |
|
|
Asian |
155 (1.5%) |
478 (2.0%) |
|
|
Native American |
32 (0.3%) |
63 (0.3%) |
|
|
Other |
325 (3.2%) |
404 (1.7%) |
|
|
Ethnicity |
|||
|
Hispanic |
232 (2.4%) |
546 (2.3%) |
>0.90 |
|
Middle Eastern/ North African |
381 (4.0%) |
387 (1.7%) |
<0.01 |
|
Insurance |
|||
|
Commercial |
5,372 (49.9%) |
12,582 (50.6%) |
0.20 |
|
Medicare |
8,190 (76.0%) |
20,346 (81.8%) |
<0.01 |
|
Medicaid |
2,202 (20.4%) |
3,202 (12.9%) |
<0.01 |
|
Dual Eligible |
79 (0.7%) |
123 (0.5%) |
0.01 |
|
N (%) or mean(Std dev). P-value < 0.05 using Chi-square or Welch’s t-test. |
|||
|
Table 3: Comorbidities by Medical Specialty |
|||
|
Characteristic |
Neurology N=10,774 |
Primary Care N=24,875 |
P-value |
|
Comorbidities |
|
|
|
|
Myocardial infraction |
229 (2.1%) |
691 (2.8%) |
<0.01 |
|
Congestive heart failure |
564 (5.2%) |
2,163 (8.7%) |
<0.01 |
|
Peripheral vascular disease |
607 (5.6%) |
2,153 (8.7%) |
<0.01 |
|
Cerebrovascular disease |
1,335 (12.4%) |
2,063 (8.3%) |
<0.01 |
|
Chronic pulmonary disease |
956 (8.9%) |
3,674 (14.8%) |
<0.01 |
|
Connective ulcer disease |
202 (1.9%) |
534 (2.1%) |
0.10 |
|
Peptic ulcer disease |
77 (0.7%) |
209 (0.8%) |
0.20 |
|
Hemiplegia or paraplegia |
62 (0.6%) |
94 (0.4%) |
0.01 |
|
Renal disease |
719 (6.7%) |
3,113 (12.5%) |
<0.01 |
|
Any malignancy |
575 (5.3%) |
1,553 (6.2%) |
<0.01 |
|
Metastatic solid tumor |
109 (1.0%) |
211 (0.8%) |
0.13 |
|
Diabetes |
1,707 (15.8%) |
6,288 (25.3%) |
<0.01 |
|
Liver disease |
97 (0.9%) |
250 (1.0%) |
0.40 |
|
Charlson Comorbidity Index |
1.0(1.6) |
1.3(1.8) |
<0.01 |
|
CCI > 0 |
|
|
<0.01 |
|
0 |
6,290 (58.4%) |
11,387 (45.8%) |
|
|
1 |
1,912 (17.7%) |
5,355 (21.5%) |
|
|
>1 |
2,572 (23.9%) |
8,133 (32.7%) |
|
|
N (%). P-value < 0.05 using Chi-square or Welch’s t-test |
|||
Acknowledgements
Funding provided by Eisai Inc and HFH Neurology.
Eisai had no role in study design, data collection, analysis, decision to publish, or preparation of the poster
Special thanks to HFH Public Health Sciences Research Analytics
Comments
Email is required but is not shown publicly.
Loading comments...