4,068 posters, 219 videos, 101 topics, 69 sessions, 14,365 authors, 6,128 institutions
ePostersLive by SciGen Technologies S.A. All rights reserved.
Alzheimer's Association International Conference 2026
July 12-15, 2026 | London, United Kingdom, and Online

2463
Subjective Cognitive Decline-plus Features And Risk Of Conversion In A Community-based Cohort With Up To 16 Years Of Follow-up
Poster Presenter
Authors
Part of Topic
Subjective cognitive decline-plus features and risk of conversion in a community-based cohort with up to 16 years of follow-up
Poosanu Thanapornsangsuth1,2, Coty Chen3, Valentina Diaz3, Carina Lo3, Lana Callies3, Jessica Buxton3, Sophia Licata3, Shaista Afzal3, Albert Pham3, Laura Fenton3, Shubir Dutt3, Adam Staffaroni3, Emily W. Paolillo3, Rowan Saloner3, Kaitlin B. Casaletto2,3, Joel H. Kramer2,3.
Background
Aim Evaluate which SCD-plus features predict progression to MCI or dementia in a low-risk, community-based cohort followed for up to 16 years.
Methods
409 cognitively normal aged ≥50 years Brain Aging Network for Cognitive Health (BrANCH) cohort(2009–2023) (Table)
Predictor:
Outcome: Consensus diagnosis of MCI or dementia
Analysis:
Results
Discussion
Contact
POOSANU THANAPORNSANGSUTH, M.D.
poosanu.thanapornsangsuth@gbhi.org
poosanu.t@chula.ac.th
Affiliations
1 King Chulalongkorn Memorial Hospital, Bangkok, Thailand, 2 Global Brain Health Institute, University of California, San Francisco, San Francisco, CA, USA, 3Edward and Pearl Fein Memory and Aging Center, University of California, San Francisco, San Francisco, CA, USA.
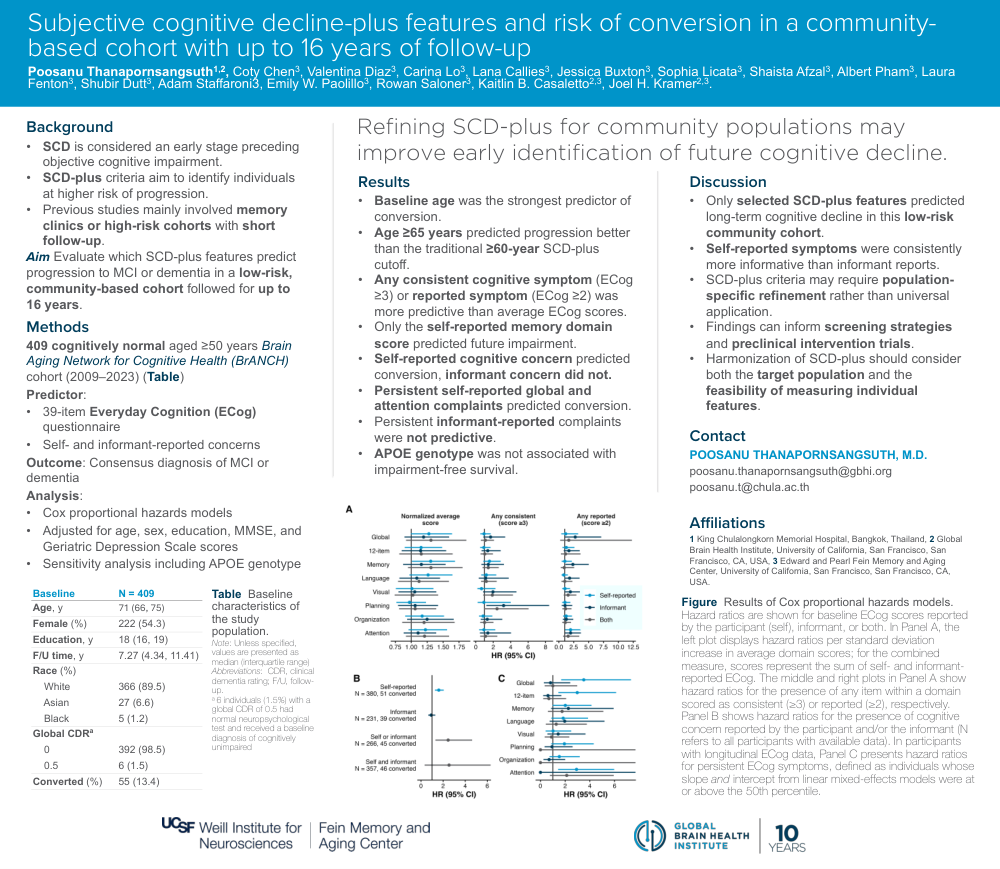
Figure Results of Cox proportional hazards models. Hazard ratios are shown for baseline ECog scores reported by the participant (self), informant, or both. In Panel A, the left plot displays hazard ratios per standard deviation increase in average domain scores; for the combined measure, scores represent the sum of self- and informant-reported ECog. The middle and right plots in Panel A show hazard ratios for the presence of any item within a domain scored as consistent (≥3) or reported (≥2), respectively. Panel B shows hazard ratios for the presence of cognitive concern reported by the participant and/or the informant (N refers to all participants withavailable data). In participants with longitudinal ECog data, Panel C presents hazard ratios for persistent ECogsymptoms, defined as individuals whose slope and intercept from linear mixed-effects models were at or above the 50th percentile.
Comments
Email is required but is not shown publicly.
Loading comments...