4,068 posters, 219 videos, 101 topics, 69 sessions, 14,365 authors, 6,128 institutions
ePostersLive by SciGen Technologies S.A. All rights reserved.
Alzheimer's Association International Conference 2026
July 12-15, 2026 | London, United Kingdom, and Online

5305
Reduced Cerebrovascular Reactivity In Mild Cognitive Impairment And Alzheimer's Disease Assessed By CO2 Challenge FMRI
Poster Presenter
Part of Topic
Background
Cerebrovascular reactivity (CVR) is the brain’s ability to regulate blood flow through dilation and and constriction of small arteriole vessels. Reduced CVR is a known hallmark of vascular disease and a risk factor for Alzheimer’s Disease (AD). Traditional CVR assessments in older adults use breath-holding or resting-state functional MRI, but these methods may fail to reach a vessel’s full dilatory capacity. Here, we employed a strong CO2 stimulus during functional MRI to map CVR. We investigated whether this robust measure of CVR serves as a marker of vascular impairment and subsequent cognitive deficits.
Objectives
Study Population
Magnetic Resonance Imaging
Analysis
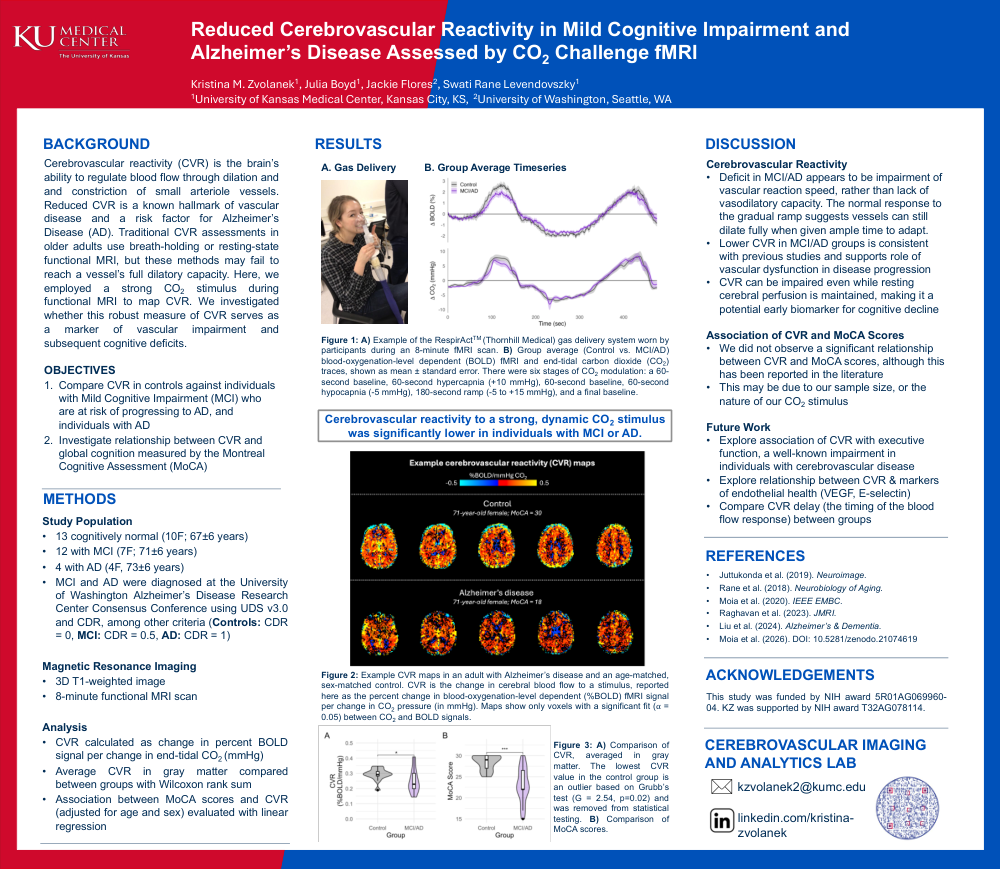
Cerebrovascular reactivity to a strong, dynamic CO2 stimulus was significantly lower in individuals with MCI or AD.
Figure 1: A) Example of the RespirActTM (Thornhill Medical) gas delivery system worn by participants during an 8-minute fMRI scan. B) Group average (Control vs. MCI/AD) blood-oxygenation-level dependent (BOLD) fMRI and end-tidal carbon dioxide (CO2) traces, shown as mean ± standard error. There were six stages of CO2 modulation: a 60-second baseline, 60-second hypercapnia (+10 mmHg), 60-second baseline, 60-second hypocapnia (-5 mmHg), 180-second ramp (-5 to +15 mmHg), and a final baseline.
Figure 2: Example CVR maps in an adult with Alzheimer’s disease and an age-matched, sex-matched control. CVR is the change in cerebral blood flow to a stimulus, reported here as the percent change in blood-oxygenation-level dependent (%BOLD) fMRI signal per change in CO2 pressure (in mmHg). Maps show only voxels with a significant fit (⍺ = 0.05) between CO2 and BOLD signals.
Figure 3: A) Comparison of CVR, averaged in gray matter. The lowest CVR value in the control group is an outlier based on Grubb’s test (G = 2.54, p=0.02) and was removed from statistical testing. B) Comparison of MoCA scores.
Discussion
Cerebrovascular Reactivity
Association of CVR and MoCA Scores
Future Work
Comments
Email is required but is not shown publicly.
Loading comments...