4,068 posters, 219 videos, 101 topics, 69 sessions, 14,365 authors, 6,128 institutions
ePostersLive by SciGen Technologies S.A. All rights reserved.
Alzheimer's Association International Conference 2026
July 12-15, 2026 | London, United Kingdom, and Online

7387
Tracking The Natural History Of Alzheimer's Disease: Plasma Biomarkers Change After Amyloid Beta Pet
Poster Presenter
Part of Topic
Tracking the natural history of Alzheimer’s disease: Plasma biomarkers change after Amyloid-β PET
Timothy Cox1*, Marcela Cespedes2, Owen Forbes3, James D Doecke2, Alzheimer's Disease Neuroimaging Initiative (ADNI), Foundation for the National Institutes of Health (FNIH) Biomarkers Consortium Plasma Aβ and Phosphorylated Tau as Predictors of Amyloid and Tau Positivity in Alzheimer's Disease Project Team.
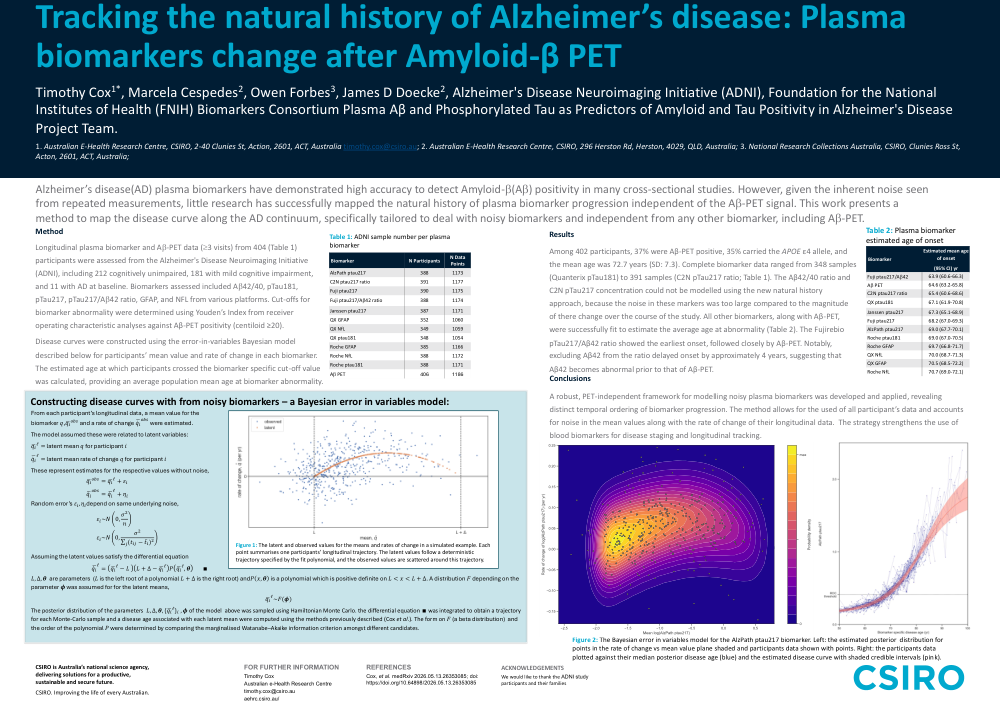
Alzheimer’s disease(AD) plasma biomarkers have demonstrated high accuracy to detect Amyloid-b(Ab) positivity in many cross-sectional studies. However, given the inherent noise seen from repeated measurements, little research has successfully mapped the natural history of plasma biomarker progression independent of the Ab-PET signal. This work presents a method to map the disease curve along the AD continuum, specifically tailored to deal with noisy biomarkers and independent from any other biomarker, including Ab-PET.
Method
Longitudinal plasma biomarker and Ab-PET data (³3 visits) from 404 (Table 1) participants were assessed from the Alzheimer's Disease Neuroimaging Initiative (ADNI), including 212 cognitively unimpaired, 181 with mild cognitive impairment, and 11 with AD at baseline. Biomarkers assessed included Ab42/40, pTau181, pTau217, pTau217/Ab42 ratio, GFAP, and NFL from various platforms. Cut-offs for biomarker abnormality were determined using Youden’s Index from receiver operating characteristic analyses against Aβ-PET positivity (centiloid ≥20).
Disease curves were constructed using the error-in-variables Bayesian model described below for participants’ mean value and rate of change in each biomarker. The estimated age at which participants crossed the biomarker specific cut-off value was calculated, providing an average population mean age at biomarker abnormality.
Table 1: ADNI sample number per plasma biomarker
Constructing disease curves with from noisy biomarkers – a Bayesian error in variables model
From each participant’s longitudinal data, a mean value for the
biomarker q, (q_i ) ̅^obs and a rate of change (q ̇_i ) ̅^obs were estimated.
The model assumed these were related to latent variables:
(q_i ) ̅^ℓ= latent mean q for participant i
(q ̇_i ) ̅^ℓ= latent mean rate of change q for participant i
These represent estimates for the respective values without noise,
Random error’s ε_i,η_idepend on same underlying noise,
Assuming the latent values satisfy the differential equation
L, Δ,θ are parameters (L is the left root of a polynomial L+Δ is the right root) andP(x,θ) is a polynomial which is positive definite on L<x<L+Δ. A distribution F depending on the parameter ϕ was assumed for for the latent means,
(q_i ) ̅^ℓ~F(ϕ)
The posterior distribution of the parameters L, Δ,θ,〖{(q_i ) ̅^ℓ}〗_i ,ϕ of the model above was sampled using Hamiltonian Monte Carlo. the differential equation ∎ was integrated to obtain a trajectory for each Monte-Carlo sample and a disease age associated with each latent mean were computed using the methods previously described (Cox et al.). The form on F (a beta distribution) and the order of the polynomial P were determined by comparing the marginalised Watanabe–Akaike information criterion amongst different candidates.
Figure 1: The latent and observed values for the means and rates of change in a simulated example. Each point summarises one participants’ longitudinal trajectory. The latent values follow a deterministic trajectory specified by the fit polynomial, and the observed values are scattered around this trajectory.
Table 2: Plasma biomarker estimated age of onset
Results
Among 402 participants, 37% were Aβ-PET positive, 35% carried the APOE ε4 allele, and the mean age was 72.7 years (SD: 7.3). Complete biomarker data ranged from 348 samples (Quanterix pTau181) to 391 samples (C2N pTau217 ratio; Table 1). The Aβ42/40 ratio and C2N pTau217 concentration could not be modelled using the new natural history approach, because the noise in these markers was too large compared to the magnitude of there change over the course of the study. All other biomarkers, along with Aβ-PET, were successfully fit to estimate the average age at abnormality (Table 2). The Fujirebio pTau217/Aβ42 ratio showed the earliest onset, followed closely by Aβ-PET. Notably, excluding Aβ42 from the ratio delayed onset by approximately 4 years, suggesting that Aβ42 becomes abnormal prior to that of Aβ-PET.
Conclusions
A robust, PET-independent framework for modelling noisy plasma biomarkers was developed and applied, revealing distinct temporal ordering of biomarker progression. The method allows for the used of all participant’s data and accounts for noise in the mean values along with the rate of change of their longitudinal data. The strategy strengthens the use of blood biomarkers for disease staging and longitudinal tracking.
Figure 2: The Bayesian error in variables model for the AlzPath ptau217 biomarker. Left: the estimated posterior distribution for points in the rate of change vs mean value plane shaded and participants data shown with points. Right: the participants data plotted against their median posterior disease age (blue) and the estimated disease curve with shaded credible intervals (pink).
Comments
Email is required but is not shown publicly.
Loading comments...