4,068 posters, 219 videos, 101 topics, 69 sessions, 14,365 authors, 6,128 institutions
ePostersLive by SciGen Technologies S.A. All rights reserved.
Alzheimer's Association International Conference 2026
July 12-15, 2026 | London, United Kingdom, and Online

7444
Plasma Proteomic Signatures Of Alzheimer's Neuropathology: Insights From Bio-hermes Study
Poster Presenter
Authors
Affiliations
Part of Topic
Plasma Proteomic Signatures of Alzheimer’s Neuropathology: Insights from Bio-Hermes Study
Introduction and Background
Results
Plasma proteomic differences across AD continuum in the Bio-Hermes Study
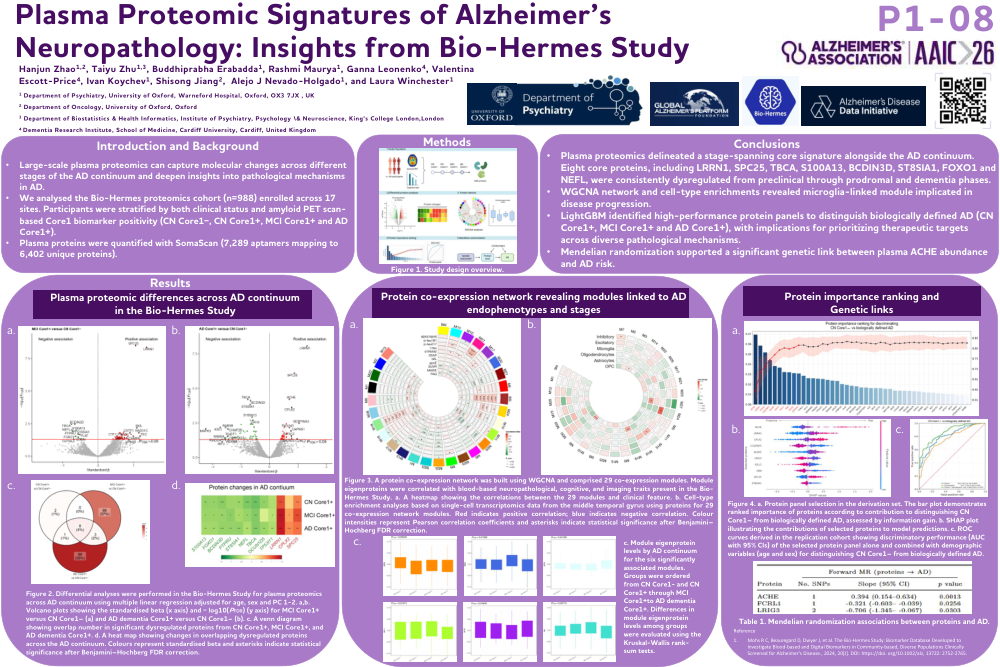
Figure 2. Differential analyses were performed in the Bio-Hermes Study for plasma proteomics across AD continuum using multiple linear regression adjusted for age, sex and PC 1-2. a,b. Volcano plots showing the standardised beta (x axis) and − log10(PFDR) (y axis) for MCI Core1+ versus CN Core1– (a) and AD dementia Core1+ versus CN Core1– (b). c. A venn diagram showing overlap number in significant dysregulated proteins from CN Core1+, MCI Core1+, and AD dementia Core1+. d. A heat map showing changes in overlapping dysregulated proteins across the AD continuum. Colours represent standardised beta and asterisks indicate statistical significance after Benjamini–Hochberg FDR correction.
Protein co-expression network revealing modules linked to AD endophenotypes and stages
Figure 3. A protein co-expression network was built using WGCNA and comprised 29 co-expression modules. Module eigenproteins were correlated with blood-based neuropathological, cognitive, and imaging traits present in the Bio-Hermes Study. a. A heatmap showing the correlations between the 29 modules and clinical feature. b. Cell-type enrichment analyses based on single-cell transcriptomics data from the middle temporal gyrus using proteins for 29 co-expression network modules. Red indicates positive correlation; blue indicates negative correlation. Colour intensities represent Pearson correlation coefficients and asterisks indicate statistical significance after Benjamini–Hochberg FDR correction. c. Module eigenprotein levels by AD continuum for the six significantly associated modules. Groups were ordered from CN Core1- and CN Core1+ through MCI Core1+to AD dementia Core1+. Differences in module eigenprotein levels among groups were evaluated using the Kruskal-Wallis rank-sum tests.
Protein importance ranking and Genetic links
Figure 4. a. Protein panel selection in the derivation set. The bar plot demonstrates ranked importance of proteins according to contribution to distinguishing CN Core1– from biologically defined AD, assessed by information gain. b. SHAP plot illustrating the contributions of selected proteins to model predictions. c. ROC curves derived in the replication cohort showing discriminatory performance (AUC with 95% CIs) of the selected protein panel alone and combined with demographic variables (age and sex) for distinguishing CN Core1– from biologically defined AD.
Table 1. Mendelian randomization associations between proteins and AD.
Conclusions
Reference
Comments
Email is required but is not shown publicly.
Loading comments...