4,068 posters, 219 videos, 101 topics, 69 sessions, 14,365 authors, 6,128 institutions
ePostersLive by SciGen Technologies S.A. All rights reserved.
Alzheimer's Association International Conference 2026
July 12-15, 2026 | London, United Kingdom, and Online

6184
Interpretable Graph Neural Network Integration Of Multimodal Biomarkers For Alzheimer’s Disease Classification
Poster Presenter
Authors
Affiliations
Part of Topic
Interpretable Graph Neural Network Integration of Multimodal Biomarkers for Alzheimer’s Disease Classification
Jazmin Lagier¹, Fahad Saeed¹
¹Knight Foundation School of Computing and Information Science, Florida International University, Miami, FL
-
Background
Alzheimer’s disease (AD) is characterized by the progressive effects of protein pathology, regional neurodegeneration, and network-level functional disruption across the brain. Multimodal neuroimaging captures complementary disease aspects: positron emission tomography (PET) quantifies molecular burden, structural magnetic resonance imaging (sMRI) measures regional atrophy, and functional MRI (fMRI) reveals connectivity alterations [1]. While evidence shows that integrating multiple data modalities may result in improved diagnostic performance, most existing approaches combine biomarkers within black-box frameworks with limited explainability.
Objective: Develop an interpretable graph-based framework that integrates multimodal biomarkers to classify cognitively normal (CN) vs. Alzheimer’s disease (AD) and to identify the brain regions and biomarkers that drive predictions.
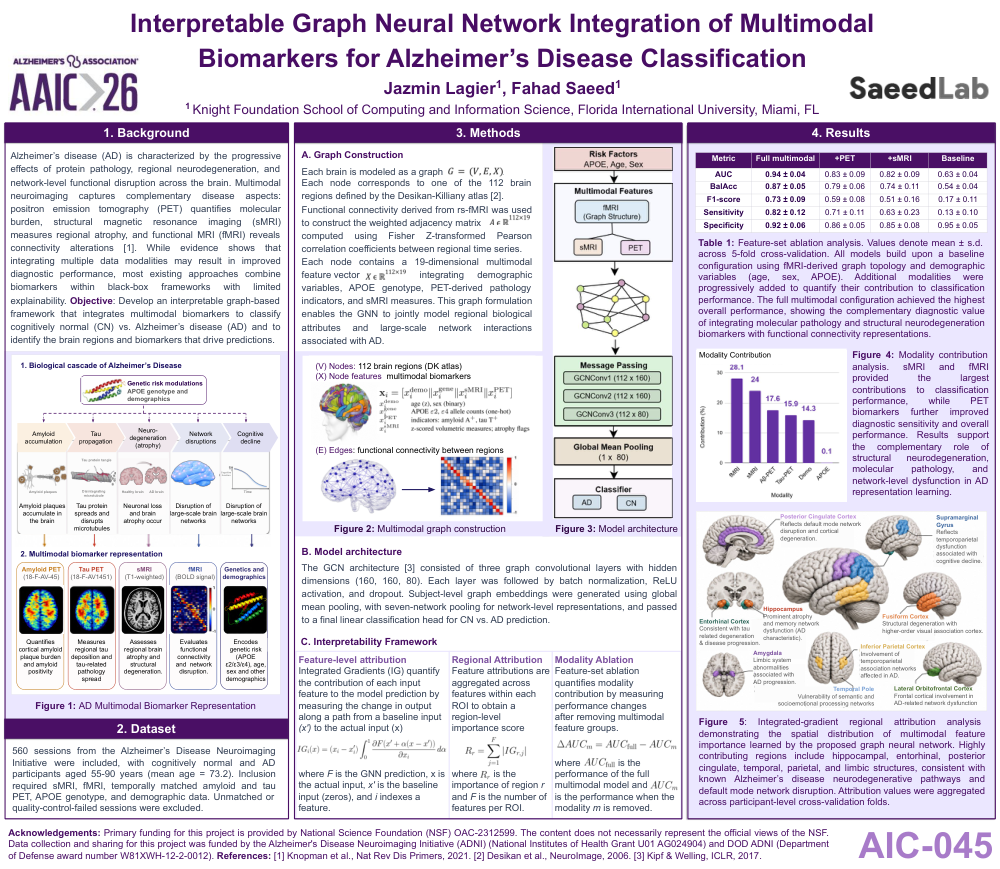
Figure 1: AD Multimodal Biomarker Representation
The figure summarizes the biological cascade of Alzheimer’s disease and the multimodal biomarker representation used in this study. Alzheimer’s disease progression includes amyloid accumulation, tau propagation, neurodegeneration/atrophy, network disruption, and cognitive decline. The multimodal biomarker representation integrates amyloid PET, tau PET, structural MRI, functional MRI, genetics, and demographic variables.
Amyloid PET (18F-AV-45) quantifies cortical amyloid plaque burden and amyloid positivity. Tau PET (18F-AV1451) measures regional tau deposition and tau-related pathology spread. sMRI (T1-weighted) assesses regional brain atrophy and structural degeneration. fMRI (BOLD signal) evaluates functional connectivity and network disruption. Genetics and demographics encode genetic risk, including APOE ε2/ε3/ε4, age, sex, and other demographic variables.
-
Dataset
A total of 560 sessions from the Alzheimer’s Disease Neuroimaging Initiative were included, with cognitively normal and AD participants aged 55–90 years, with a mean age of 73.2 years. Inclusion required sMRI, fMRI, temporally matched amyloid and tau PET, APOE genotype, and demographic data. Unmatched or quality-control-failed sessions were excluded.
-
Methods
A. Graph Construction
Each brain was modeled as a graph G = (V, E, X). Each node corresponds to one of the 112 brain regions defined by the Desikan-Killiany atlas [2]. Functional connectivity derived from rs-fMRI was used to construct the weighted adjacency matrix, computed using Fisher Z-transformed Pearson correlation coefficients between regional time series. Each node contains a 19-dimensional multimodal feature vector integrating demographic variables, APOE genotype, PET-derived pathology indicators, and sMRI measures. This graph formulation enables the GNN to jointly model regional biological attributes and large-scale network interactions associated with AD.
Figure 2: Multimodal Graph Construction
The multimodal graph representation includes nodes, node features, and edges. Nodes represent 112 brain regions from the Desikan-Killiany atlas. Node features represent multimodal biomarkers, including demographic variables, APOE genotype, PET-derived pathology indicators, and sMRI measures. Edges represent functional connectivity between brain regions derived from rs-fMRI.
B. Model Architecture
The GCN architecture [3] consisted of three graph convolutional layers with hidden dimensions of 160, 160, and 80. Each layer was followed by batch normalization, ReLU activation, and dropout. Subject-level graph embeddings were generated using global mean pooling, with seven-network pooling for network-level representations, and passed to a final linear classification head for CN vs. AD prediction.
Figure 3: Model Architecture
The model architecture integrates risk factors, multimodal features, graph-based message passing, global mean pooling, and a final classifier for AD vs. CN prediction. Risk factors include APOE, age, and sex. Multimodal features include fMRI graph structure, sMRI, and PET. Message passing was performed using three graph convolutional layers, followed by global mean pooling and final classification.
C. Interpretability Framework
Feature-level attribution: Integrated Gradients (IG) quantify the contribution of each input feature to the model prediction by measuring the change in output along a path from a baseline input to the actual input. In this formulation, F is the GNN prediction, x is the actual input, x′ is the baseline input of zeros, and i indexes a feature.
Regional attribution: Feature attributions are aggregated across features within each ROI to obtain a region-level importance score. Rr represents the importance of region r, and F is the number of features per ROI.
Modality ablation: Feature-set ablation quantifies modality contribution by measuring performance changes after removing multimodal feature groups. The change in AUC was computed as the difference between the performance of the full multimodal model and the performance when modality m was removed.
-
Results
Table 1: Feature-Set Ablation Performance Across Modalities
Values denote mean ± standard deviation across 5-fold cross-validation. All models build upon a baseline configuration using fMRI-derived graph topology and demographic variables, including age, sex, and APOE. Additional modalities were progressively added to quantify their contribution to classification performance.
AUC: Full multimodal, 0.94 ± 0.04; +PET, 0.83 ± 0.09; +sMRI, 0.82 ± 0.09; Baseline, 0.63 ± 0.04.
Balanced accuracy: Full multimodal, 0.87 ± 0.05; +PET, 0.79 ± 0.06; +sMRI, 0.74 ± 0.11; Baseline, 0.54 ± 0.04.
F1-score: Full multimodal, 0.73 ± 0.09; +PET, 0.59 ± 0.08; +sMRI, 0.51 ± 0.16; Baseline, 0.17 ± 0.11.
Sensitivity: Full multimodal, 0.82 ± 0.12; +PET, 0.71 ± 0.11; +sMRI, 0.63 ± 0.23; Baseline, 0.13 ± 0.10.
Specificity: Full multimodal, 0.92 ± 0.06; +PET, 0.86 ± 0.05; +sMRI, 0.85 ± 0.08; Baseline, 0.95 ± 0.05.
The full multimodal configuration achieved the highest overall performance, showing the complementary diagnostic value of integrating molecular pathology and structural neurodegeneration biomarkers with functional connectivity representations.
Figure 4: Modality Contribution Analysis
The modality contribution analysis showed that sMRI and fMRI provided the largest contributions to classification performance, while PET biomarkers further improved diagnostic sensitivity and overall performance. Results support the complementary role of structural neurodegeneration, molecular pathology, and network-level dysfunction in AD representation learning.
Figure 5: Regional Integrated-Gradient Attribution Analysis
Integrated-gradient regional attribution analysis demonstrated the spatial distribution of multimodal feature importance learned by the proposed graph neural network. Highly contributing regions included hippocampal, entorhinal, posterior cingulate, temporal, parietal, and limbic structures, consistent with known Alzheimer’s disease neurodegenerative pathways and default mode network disruption. Attribution values were aggregated across participant-level cross-validation folds.
The regional attribution map highlighted several AD-relevant regions. The posterior cingulate cortex reflects default mode network disruption and cortical degeneration. The hippocampus shows prominent atrophy and memory network dysfunction characteristic of AD. The entorhinal cortex is consistent with tau-related degeneration and disease progression. The inferior parietal cortex reflects involvement of temporoparietal association networks affected in AD. The fusiform cortex reflects structural degeneration within higher-order visual association cortex. The amygdala reflects limbic system abnormalities associated with AD progression. The temporal pole reflects vulnerability of semantic and socioemotional processing networks. The lateral orbitofrontal cortex reflects frontal cortical involvement in AD-related network dysfunction. The supramarginal gyrus reflects temporoparietal dysfunction associated with cognitive decline.
Acknowledgements
Primary funding for this project is provided by National Science Foundation (NSF) OAC-2312599. The content does not necessarily represent the official views of the NSF. Data collection and sharing for this project was funded by the Alzheimer’s Disease Neuroimaging Initiative (ADNI), National Institutes of Health Grant U01 AG024904, and DOD ADNI, Department of Defense award number W81XWH-12-2-0012.
References
[1] Knopman et al., Nat Rev Dis Primers, 2021. [2] Desikan et al., NeuroImage, 2006. [3] Kipf & Welling, ICLR, 2017.
Poster Number: AIC-045
Comments
Email is required but is not shown publicly.
Loading comments...