4,068 posters, 219 videos, 101 topics, 69 sessions, 14,365 authors, 6,128 institutions
ePostersLive by SciGen Technologies S.A. All rights reserved.
Alzheimer's Association International Conference 2026
July 12-15, 2026 | London, United Kingdom, and Online

9265
Neuroanatomic Patterns Of Mixed Pathology In Neuronal Alpha-synucleinopathies
Poster Presenter
Authors
Klara Gawor, Sheina Emrani, Nadia Dehghani, Sharon Xie, Corey McMillan, John L. Robinson, Daniel Weintraub, David Wolk, Alice Chen-Plotkin, Edward B. Lee, David J. Irwin
Affiliations
Department of Neurology, University of Pennsylvania, USA, Department of Pathology and Laboratory Medicine, University of Pennsylvania, USA, Department of Psychiatry, University of Pennsylvania, USA
Part of Topic
BACKGROUND
• There is an overlap in the characteristics of patients with PD, PDD, and DLB.
• Approximately 50% of AD cases show α-synuclein co-pathology.¹,² Similarly, 50% of all LBD cases have intermediate to high levels of AD pathology.³,⁴
• Tau and Aβ levels modify the clinical and biological profiles of patients with LBD.⁵,⁶,⁷
• Data-driven subtyping has focused primarily on α-synuclein pathology, which does not account for all observed biological variance.⁸,⁹
STUDY GOAL: Develop a data-driven, clinic-blind multipathology framework for understanding the AD-LBD spectrum.
METHODS: 566 neuronal α-synuclein+ (NAS) cases
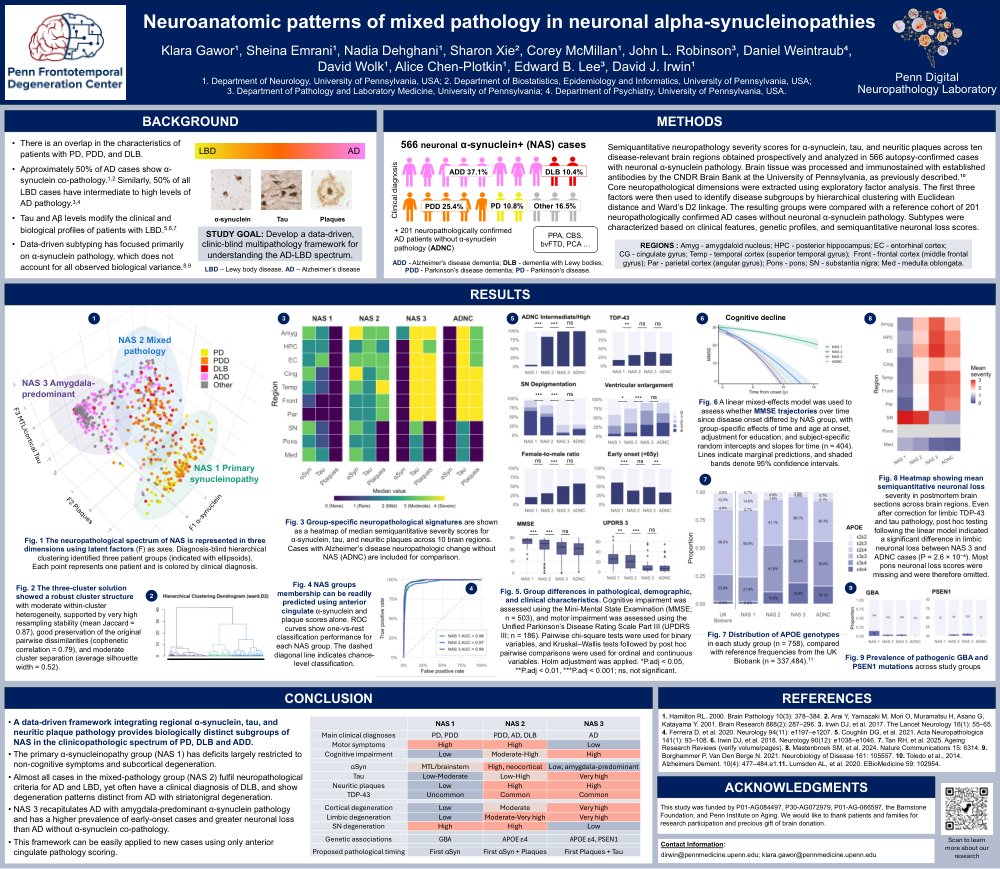
Semiquantitative neuropathology severity scores for α-synuclein, tau, and neuritic plaques across ten disease-relevant brain regions were obtained prospectively and analyzed in 566 autopsy-confirmed cases with neuronal α-synuclein pathology. Brain tissue was processed and immunostained with established antibodies by the CNDR Brain Bank at the University of Pennsylvania, as previously described.¹⁰ Core neuropathological dimensions were extracted using exploratory factor analysis. The first three factors were then used to identify disease subgroups by hierarchical clustering with Euclidean distance and Ward’s D2 linkage. The resulting groups were compared with a reference cohort of 201 neuropathologically confirmed AD cases without neuronal α-synuclein pathology. Subtypes were characterized based on clinical features, genetic profiles, and semiquantitative neuronal loss scores.
REGIONS: Amyg, amygdaloid nucleus; HPC, posterior hippocampus; EC, entorhinal cortex; CG, cingulate gyrus; Temp, temporal cortex, superior temporal gyrus; Front, frontal cortex, middle frontal gyrus; Par, parietal cortex, angular gyrus; Pons, pons; SN, substantia nigra; Med, medulla oblongata.
CONCLUSIONS
• A data-driven framework integrating regional α-synuclein, tau, and neuritic plaque pathology provides biologically distinct subgroups of NAS in the clinicopathologic spectrum of PD, DLB, and ADD.
• The primary α-synucleinopathy group, NAS 1, has deficits largely restricted to non-cognitive symptoms and subcortical degeneration.
• Almost all cases in the mixed-pathology group, NAS 2, fulfill neuropathological criteria for AD and LBD, yet often have a clinical diagnosis of DLB, and show degeneration patterns distinct from AD with striatonigral degeneration.
• NAS 3 recapitulates AD with amygdala-predominant α-synuclein pathology and has a higher prevalence of early-onset cases and greater neuronal loss than AD without α-synuclein co-pathology.
• This framework can be easily applied to new cases using only anterior cingulate pathology scoring.
RESULTS
Fig. 1. The neuropathological spectrum of NAS is represented in three dimensions using latent factors (F) as axes. Diagnosis-blind hierarchical clustering identified three patient groups, indicated with ellipsoids. Each point represents one patient and is colored by clinical diagnosis.
Fig. 2. The three-cluster solution showed a robust cluster structure with moderate within-cluster heterogeneity, supported by very high resampling stability, mean Jaccard = 0.87, good preservation of the original pairwise dissimilarities, cophenetic correlation = 0.79, and moderate cluster separation, average silhouette width = 0.52.
Fig. 3. Group-specific neuropathological signatures are shown as a heatmap of median semiquantitative severity scores for α-synuclein, tau, and neuritic plaques across 10 brain regions. Cases with Alzheimer’s disease neuropathologic change without NAS, ADNC, are included for comparison.
Fig. 4. NAS group membership can be readily predicted using anterior cingulate α-synuclein and plaque scores alone. ROC curves show one-vs-rest classification performance for each NAS group. The dashed diagonal line indicates chance-level classification.
Fig. 5. Group differences in pathological, demographic, and clinical characteristics. Cognitive impairment was assessed using the Mini-Mental State Examination, MMSE, n = 503, and motor impairment was assessed using the Unified Parkinson’s Disease Rating Scale Part III, UPDRS III, n = 186. Pairwise chi-square tests were used for binary variables, and Kruskal-Wallis tests followed by post hoc pairwise comparisons were used for ordinal and continuous variables. Holm adjustment was applied. *P.adj < 0.05, **P.adj < 0.01, ***P.adj < 0.001; ns, not significant.
Fig. 6. A linear mixed-effects model was used to assess whether MMSE trajectories over time since disease onset differed by NAS group, with group-specific effects of time and age at onset, adjustment for education, and subject-specific random intercepts and slopes for time, n = 404. Lines indicate marginal predictions, and shaded bands denote 95% confidence intervals.
APOE
Fig. 7. Distribution of APOE genotypes in each study group, n = 758, compared with reference frequencies from the UK Biobank, n = 337,484.¹¹
Fig. 8. Heatmap showing mean semiquantitative neuronal loss severity in postmortem brain sections across brain regions. Even after correction for limbic TDP-43 and tau pathology, post hoc testing following the linear model indicated a significant difference in limbic neuronal loss between NAS 3 and ADNC cases, P = 2.6 × 10⁻⁴. Most pons neuronal loss scores were missing and were therefore omitted.
Fig. 9. Prevalence of pathogenic GBA and PSEN1 mutations across study groups.
Comments
Email is required but is not shown publicly.
Loading comments...