4,068 posters, 219 videos, 101 topics, 69 sessions, 14,365 authors, 6,128 institutions
ePostersLive by SciGen Technologies S.A. All rights reserved.
Alzheimer's Association International Conference 2026
July 12-15, 2026 | London, United Kingdom, and Online

4694
Long-term Longitudinal Patterns Of Hypometabolism And Atrophy Progression From Preclinical To Dementia Stages Of Alzheimer's Disease
Poster Presenter
Part of Topic
INTRODUCTION
Structural MRI–derived atrophy and FDG-PET–measured hypometabolism are complementary markers of neurodegeneration in Alzheimer’s disease (AD), capturing cumulative tissue loss and synaptic–neuronal dysfunction, respectively.
However, the temporo-spatial evolution of cortical hypometabolism and atrophy patterns from preclinical stages to AD dementia remains incompletely understood.
Aim: In this study, we investigated the temporal evolution of cortical hypometabolism and atrophy using serial FDG-PET and MRI acquisitions in individuals who developed AD dementia.
METHODS
Participants: 208 nondemented individuals (15% CU, 85% MCI) enrolled in the ADNI study who developed biomarker-confirmed AD dementia over clinical follow-up (Table 1).
• All participants underwent serial MRI and [18F]FDG-PET acquisitions spanning from −15 years before to +5 years after dementia onset.
Neuroimaging:
• Cortical thickness on MRI and standardized uptake value ratios on FDG-PET were calculated across 200 cortical regions defined in the Schaefer atlas.
• Region-wise z-scores were calculated to quantify cortical thickness and hypometabolism relative to healthy elderly controls (N(MRI)=218, N(FDG)=56).
Statistical analyses:
-
Longitudinal atrophy and hypometabolism progression of each brain region was calculated using linear mixed-effects models adjusted for age and sex.
-
Predicted z-scores were generated at 2-year intervals spanning from −10 years before dementia onset to +2 years after.
-
Inter-modality z-score differences quantified the relative predominance of regional hypometabolism versus atrophy over the course of disease progression.
-
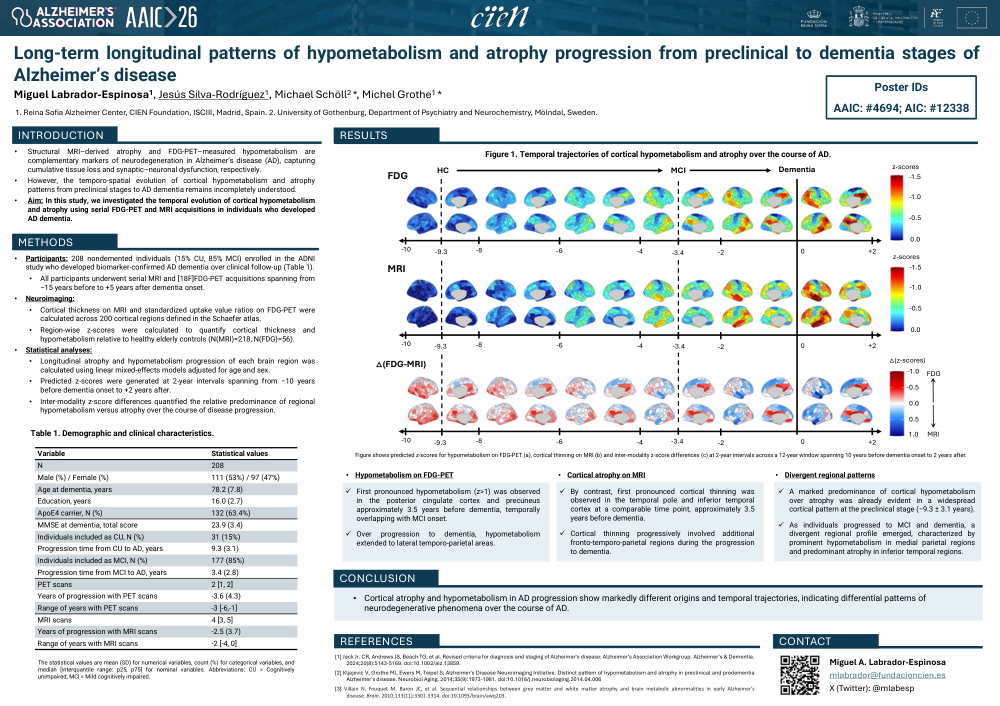
First pronounced hypometabolism (z>1) was observed in the posterior cingulate cortex and precuneus approximately 3.5 years before dementia, temporally overlapping with MCI onset.
-
Over progression to dementia, hypometabolism extended to lateral temporo-parietal areas.
-
By contrast, first pronounced cortical thinning was observed in the temporal pole and inferior temporal cortex at a comparable time point, approximately 3.5 years before dementia.
-
Cortical thinning progressively involved additional fronto-temporo-parietal regions during the progression to dementia.
-
A marked predominance of cortical hypometabolism over atrophy was already evident in a widespread cortical pattern at the preclinical stage (−9.3 ± 3.1 years).
-
As individuals progressed to MCI and dementia, a divergent regional profile emerged, characterized by prominent hypometabolism in medial parietal regions and predominant atrophy in inferior temporal regions.
CONCLUSION
• Cortical atrophy and hypometabolism in AD progression show markedly different origins and temporal trajectories, indicating differential patterns of neurodegenerative phenomena over the course of AD.
REFERENCES
[1] Jack Jr. CR, Andrews JS, Beach TG, et al. Revised criteria for diagnosis and staging of Alzheimer’s disease: Alzheimer’s Association Workgroup. Alzheimer’s & Dementia. 2024;20(8):5143-5169. doi:10.1002/alz.13859.
[2]KljajevicV,GrotheMJ,EwersM,TeipelS;Alzheimer'sDiseaseNeuroimagingInitiative.Distinctpatternofhypometabolismandatrophyinpreclinicalandpredementia Alzheimer's disease. Neurobiol Aging. 2014;35(9):1973-1981. doi:10.1016/j.neurobiolaging.2014.04.006
[3] Villain N, Fouquet M, Baron JC, et al. Sequential relationships between grey matter and white matter atrophy and brain metabolic abnormalities in early Alzheimer's disease. Brain. 2010;133(11):3301-3314. doi:10.1093/brain/awq203.
Comments
Email is required but is not shown publicly.
Loading comments...