4,068 posters, 219 videos, 101 topics, 69 sessions, 14,365 authors, 6,128 institutions
ePostersLive by SciGen Technologies S.A. All rights reserved.
Alzheimer's Association International Conference 2026
July 12-15, 2026 | London, United Kingdom, and Online

7066
Disentangling Synaptic Degeneration And Structural Neurodegeneration Across The Alzheimer’S Disease Continuum
Poster Presenter
Authors
Part of Topic
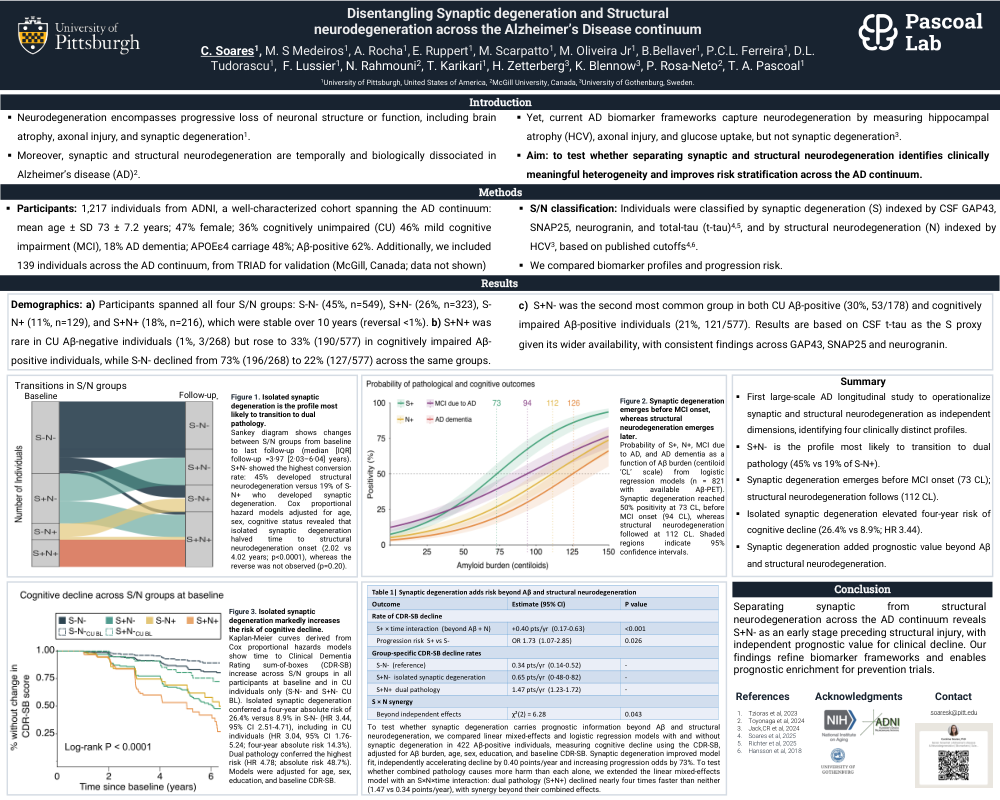
Background: Synaptic degeneration is closely linked to cognitive impairment in AD and mayprecede structural neurodegeneration. CSF total tau, though commonly viewed as a neuronalinjury marker, more closely reflects synaptic dysfunction than brain atrophy. We tested whetherseparating synaptic from structural neurodegeneration improves clinical risk stratification acrossthe AD continuum.Methods: We analyzed longitudinal data from 1,217 ADNI participants (mean age 73±7.2 years)spanning the AD continuum (CU=440, MCI=556, AD dementia=221). Synaptic degeneration (S)was defined using synaptic protein, CSF total tau, and neurodegeneration (N) was measured byhippocampal volume below the 5th percentile of CU-Aβ-negative individuals, yielding four S/Nprofiles (S-N-, S+N-, S-N+, S+N+). Group differences were assessed using adjusted linearmodels, and risk of cognitive decline measured by CDR-sum-of-boxes was evaluated usingadjusted Cox proportional hazards models.Results: Participants were classified at baseline as S-N- (45%, n=549), S+N- (26%, n=323),S-N+(11%, n=129), or S+N+(18%, n=216) (Table 1).CU-Aβ-negative individuals were predominantlyS-N-(73%), whereas CU-Aβ-positive showed enrichment of S+N- of 30% (Fig.1a). Among CI-Aβ-negative individuals, S-N- remained most common (59%), while CI-Aβ-positive individualsshowed marked predominance of S+N+(33%) and S+N- (31%), with S-N- reduced to 22%. Baselinecognition was best in S-N- and worst in S+N+ across memory, language, and executive domains(Fig.1b). At last follow-up, S/N classifications were largely stable, but S+N- individuals showedthe lowest stability (55%) and the highest likelihood of progressing to combined pathology(S+N+)(Fig.2a). Over 6 years, risk of cognitive decline differed by S/N group (log-rank P<0.0001)(Fig.2b).Compared with S-N-, adjusted hazard ratios were 3.81 for S+N-, 4.13 for S-N+, and6.72 for S+N+ (Fig.2c).Four-year absolute risk was 8.7% in S-N-, 24.8% in S+N, 27.1% in S-N+,and 45.8% in S+N+ (Fig.2d).Conclusion: Distinguishing synaptic from structural neurodegeneration improves riskstratification and prediction of cognitive decline across the AD continuum, extending currentneurodegeneration markers and refining biological staging of disease progression. Thus, the S/Nframework provides a pragmatic basis for prognostic enrichment, with potential to increaseefficiency of predicting disease progression in early stages of the disease.
Comments
Email is required but is not shown publicly.
Loading comments...