4,068 posters, 219 videos, 101 topics, 69 sessions, 14,365 authors, 6,128 institutions
ePostersLive by SciGen Technologies S.A. All rights reserved.
Alzheimer's Association International Conference 2026
July 12-15, 2026 | London, United Kingdom, and Online

9298
Modeling Neurovascular Communication In Alzheimer’S Disease Via Extracellular Vesicles In A 3dIn VitroModel Of The Blood-brain Barrier
Poster Presenter
Authors
Vishal Singh Guleria, Violaine Delorme-walker, Cecilia Marcondes, Charisse Winston
Affiliations
Department of Physiology and Neuroscience, Epstein Family Alzheimer’s Therapeutic Research Institute, Keck School of Medicine at USC, San Diego, CA, USA, San Diego Biomedical Research Institute, San Diego, CA, USA
Part of Topic
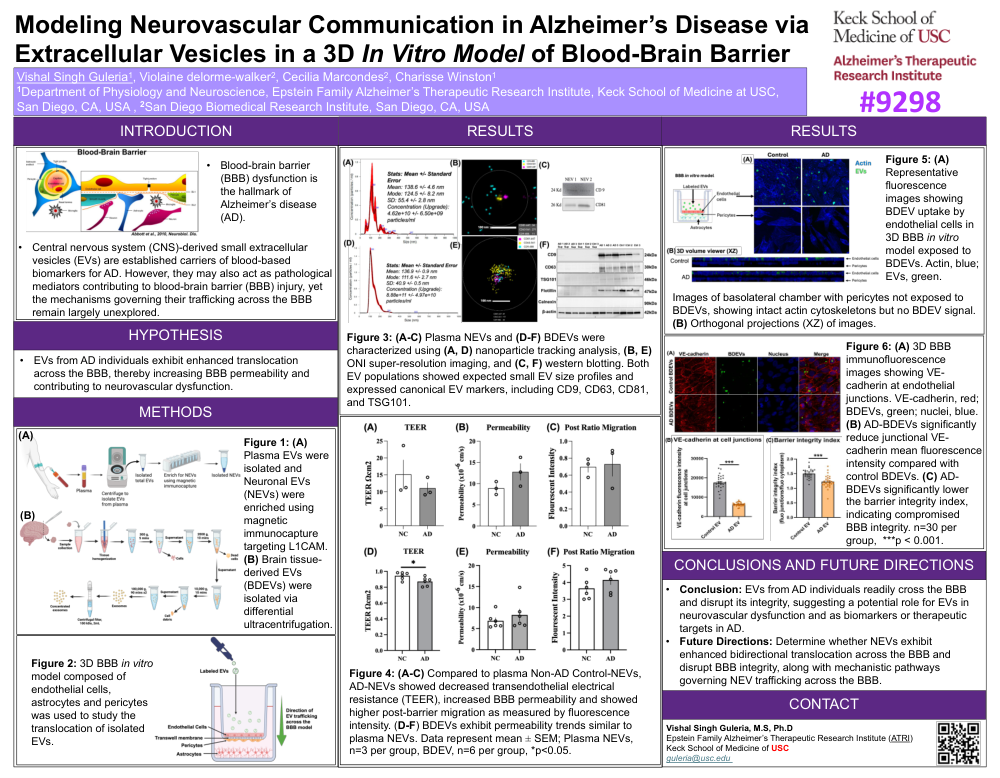
TITLE: Modeling Neurovascular Communication in Alzheimer’s Disease via Extracellular Vesicles in a 3D In Vitro Model of Blood-Brain Barrier
AUTHORS: Vishal Singh Guleria1, Violaine delorme-walker2, Cecilia Marcondes2, Charisse Winston1
1Department of Physiology and Neuroscience, Epstein Family Alzheimer’s Therapeutic Research Institute, Keck School of Medicine at USC, San Diego, CA, USA.
2San Diego Biomedical Research Institute, San Diego, CA, USA.
INTRODUCTION:
HYPOTHESIS: EVs from AD individuals exhibit enhanced translocation across the BBB, thereby increasing BBB permeability and contributing to neurovascular dysfunction.
METHODS:
Figure 1: (A) Plasma EVs were isolated and Neuronal EVs (NEVs) were enriched using magnetic immunocapture targeting L1CAM. (B) Brain tissue-derived EVs (BDEVs) were isolated via differential ultracentrifugation.
Figure 2: 3D BBB in vitro model composed of endothelial cells, astrocytes and pericytes was used to study the translocation of isolated EVs.
RESULTS:
Figure 3: (A-C) Plasma NEVs and (D-F) BDEVs were characterized using (A, D) nanoparticle tracking analysis, (B, E) ONI super-resolution imaging, and (C, F) western blotting. Both EV populations showed expected small EV size profiles and expressed canonical EV markers, including CD9, CD63, CD81, and TSG101.
Figure 4: (A-C) Compared to plasma Non-AD Control-NEVs, AD-NEVs showed decreased transendothelial electrical resistance (TEER), increased BBB permeability and showed higher post-barrier migration as measured by fluorescence intensity. (D-F) BDEVs exhibit permeability trends similar to plasma NEVs. Data represent mean ± SEM; Plasma NEVs, n=3 per group, BDEV, n=6 per group, *p<0.05.
Figure 5: (A) Representative fluorescence images showing BDEV uptake by endothelial cells in 3D BBB in vitro model exposed to BDEVs. Actin, blue; EVs, green. Images of basolateral chamber with pericytes not exposed to BDEVs, showing intact actin cytoskeletons but no BDEV signal. (B) Orthogonal projections (XZ) of images.
Figure 6: (A) 3D BBB immunofluorescence images showing VE-cadherin at endothelial junctions. VE-cadherin, red; BDEVs, green; nuclei, blue. (B) AD-BDEVs significantly reduce junctional VE-cadherin mean fluorescence intensity compared with control BDEVs. (C) AD-BDEVs significantly lower the barrier integrity index, indicating compromised BBB integrity. n=30 per group, ***p < 0.001.
CONCLUSIONS AND FUTURE DIRECTIONS:
CONTACT: Vishal Singh Guleria, M.S, Ph.D (guleria@usc.edu)
Epstein Family Alzheimer’s Therapeutic Research Institute (ATRI), Keck School of Medicine at USC, San Diego, CA, USA
Comments
Email is required but is not shown publicly.
Loading comments...