4,068 posters, 219 videos, 101 topics, 69 sessions, 14,365 authors, 6,128 institutions
ePostersLive by SciGen Technologies S.A. All rights reserved.
Alzheimer's Association International Conference 2026
July 12-15, 2026 | London, United Kingdom, and Online

7096
Plasma Neurodegenerative Markers As Predictors Of Braak Stage In An Autopsy Cohort
Part of Topic
Video
Background -
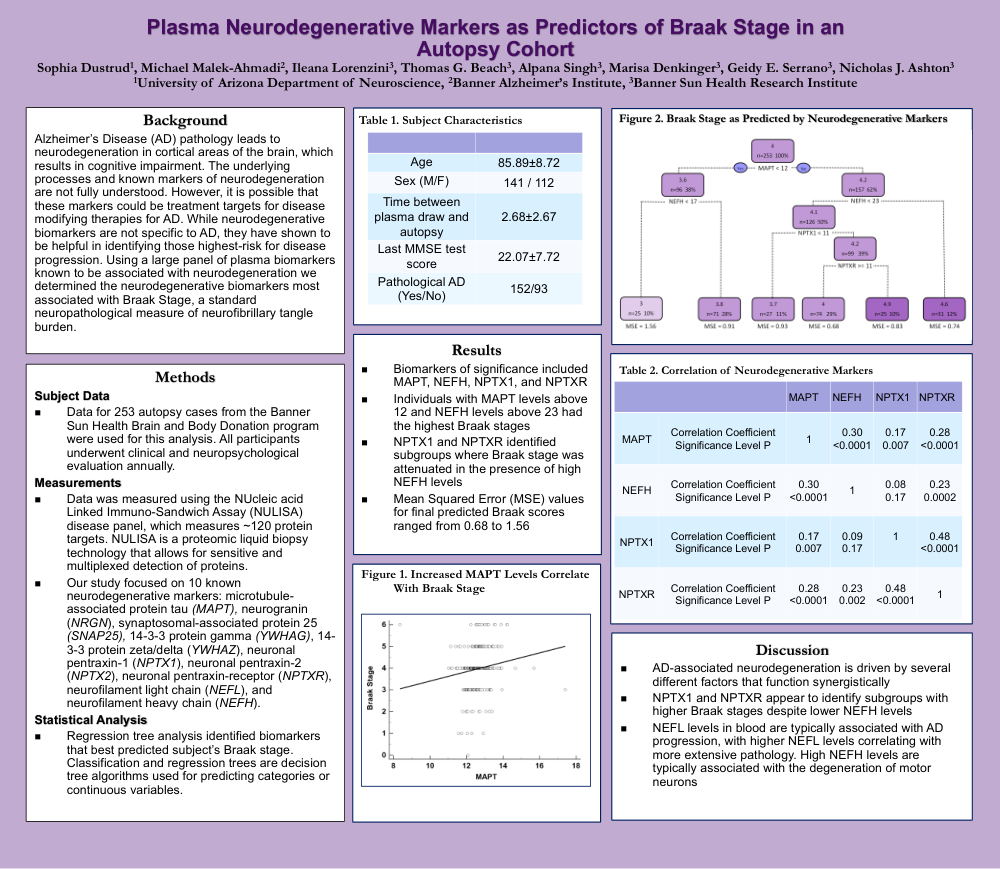
Alzheimer’s Disease (AD) pathology leads to neurodegeneration in cortical areas of the brain, which results in cognitive impairment. The underlying processes and known markers of neurodegeneration are not fully understood. However, it is possible that these markers could be treatment targets for disease modifying therapies for AD. While neurodegenerative biomarkers are not specific to AD, they have shown to be helpful in identifying those highest-risk for disease progression. Using a large panel of plasma biomarkers known to be associated with neurodegeneration we determined the neurodegenerative biomarkers most associated with Braak Stage, a standard neuropathological measure of neurofibrillary tangle burden.
Methods -
Subject Data ◼ Data for 253 autopsy cases from the Banner Sun Health Brain and Body Donation program were used for this analysis. All participants underwent clinical and neuropsychological evaluation annually.
Measurements ◼ Data was measured using the NUcleic acid Linked Immuno-Sandwich Assay (NULISA) disease panel, which measures ~120 protein targets. NULISA is a proteomic liquid biopsy technology that allows for sensitive and multiplexed detection of proteins. ◼ Our study focused on 10 known neurodegenerative markers: microtubuleassociated protein tau (MAPT), neurogranin (NRGN), synaptosomal-associated protein 25 (SNAP25), 14-3-3 protein gamma (YWHAG), 14- 3-3 protein zeta/delta (YWHAZ), neuronal pentraxin-1 (NPTX1), neuronal pentraxin-2 (NPTX2), neuronal pentraxin-receptor (NPTXR), neurofilament light chain (NEFL), and neurofilament heavy chain (NEFH).
Statistical Analysis ◼ Regression tree analysis identified biomarkers that best predicted subject’s Braak stage. Classification and regression trees are decision tree algorithms used for predicting categories or continuous variables.
Results -
Biomarkers of significance included MAPT, NEFH, NPTX1, and NPTXR ◼ Individuals with MAPT levels above 12 and NEFH levels above 23 had the highest Braak stages ◼ NPTX1 and NPTXR identified subgroups where Braak stage was attenuated in the presence of high NEFH levels ◼ Mean Squared Error (MSE) values for final predicted Braak scores ranged from 0.68 to 1.56
Conclusion -
AD-associated neurodegeneration is driven by several different factors that function synergistically ◼ NPTX1 and NPTXR appear to identify subgroups with higher Braak stages despite lower NEFH levels ◼ NEFL levels in blood are typically associated with AD progression, with higher NEFL levels correlating with more extensive pathology. High NEFH levels are typically associated with the degeneration of motor neurons
Keywords: Plasma Biomarkers; Neurodegeneration; Decision Tree Analysis; NULISA
Comments
Email is required but is not shown publicly.
Loading comments...