4,068 posters, 219 videos, 101 topics, 69 sessions, 14,365 authors, 6,128 institutions
ePostersLive by SciGen Technologies S.A. All rights reserved.
Alzheimer's Association International Conference 2026
July 12-15, 2026 | London, United Kingdom, and Online

6868
Studying Brain Microstructure Changes In Aging Using Multi-Dimensional Diffusion Encoding MRI
Poster Presenter
Part of Topic
Introduction:
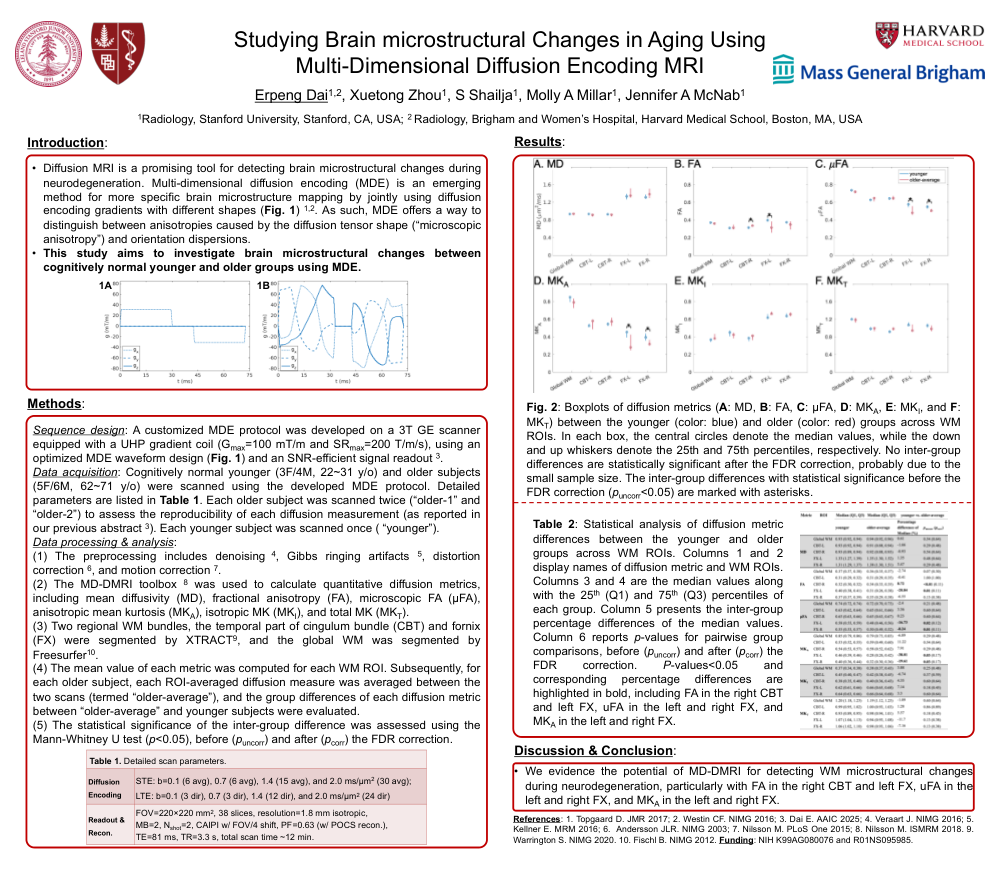
Diffusion MRI is a promising tool for detecting brain microstructural changes during neurodegeneration. Multi-dimensional diffusion encoding (MDE) is an emerging method for more specific brain microstructure mapping by jointly using diffusion encoding gradients with different shapes (Fig. 1) 1,2. As such, MDE offers a way to distinguish between anisotropies caused by the diffusion tensor shape (“microscopic anisotropy”) and orientation dispersions.
This study aims to investigate brain microstructural changes between cognitively normal younger and older groups
Methods:
Sequence design: A customized MDE protocol was developed on a 3T GE scanner equipped with a UHP gradient coil (Gmax=100 mT/m and SRmax=200 T/m/s), using an optimized MDE waveform design (Fig. 1) and an SNR-efficient signal readout 3.
Data acquisition: Cognitively normal younger (3F/4M, 22~31 y/o) and older subjects (5F/6M, 62~71 y/o) were scanned using the developed MDE protocol. Detailed parameters are listed in Table 1. Each older subject was scanned twice (“older-1” and “older-2”) to assess the reproducibility of each diffusion measurement (as reported in our previous abstract 3). Each younger subject was scanned once ( “younger”).
Data processing & analysis:
(1) The preprocessing includes denoising 4, Gibbs ringing artifacts 5, distortion correction 6, and motion correction 7.
(2) The MD-DMRI toolbox 8 was used to calculate quantitative diffusion metrics, including mean diffusivity (MD), fractional anisotropy (FA), microscopic FA (μFA), anisotropic mean kurtosis (MKA), isotropic MK (MKI), and total MK (MKT).
(3) Two regional WM bundles, the temporal part of cingulum bundle (CBT) and fornix (FX) were segmented by XTRACT9, and the global WM was segmented by Freesurfer10.
(4) The mean value of each metric was computed for each WM ROI. Subsequently, for each older subject, each ROI-averaged diffusion measure was averaged between the two scans (termed “older-average”), and the group differences of each diffusion metric between “older-average” and younger subjects were evaluated.
(5) The statistical significance of the inter-group difference was assessed using the Mann-Whitney U test (p<0.05), before (puncorr) and after (pcorr) the FDR correction.
Results:
Fig. 2: Boxplots of diffusion metrics (A: MD, B: FA, C: μFA, D: MKA, E: MKI, and F: MKT) between the younger (color: blue) and older (color: red) groups across WM ROIs. In each box, the central circles denote the median values, while the down and up whiskers denote the 25th and 75th percentiles, respectively. No inter-group differences are statistically significant after the FDR correction, probably due to the small sample size. The inter-group differences with statistical significance before the FDR correction (puncorr<0.05) are marked with asterisks.
Table 2: Statistical analysis of diffusion metric differences between the younger and older groups across WM ROIs. Columns 1 and 2 display names of diffusion metric and WM ROIs. Columns 3 and 4 are the median values along with the 25th (Q1) and 75th (Q3) percentiles of each group. Column 5 presents the inter-group percentage differences of the median values. Column 6 reports p-values for pairwise group comparisons, before (puncorr) and after (pcorr) the FDR correction. P-values<0.05 and corresponding percentage differences are highlighted in bold, including FA in the right CBT and left FX, uFA in the left and right FX, and MKA in the left and right FX.
Discussion & Conclusion:
We evidence the potential of MD-DMRI for detecting WM microstructural changes during neurodegeneration, particularly with FA in the right CBT and left FX, uFA in the left and right FX, and MKA in the left and right FX.
References: 1. Topgaard D. JMR 2017; 2. Westin CF. NIMG 2016; 3. Dai E. AAIC 2025; 4. Veraart J. NIMG 2016; 5. Kellner E. MRM 2016; 6. Andersson JLR. NIMG 2003; 7. Nilsson M. PLoS One 2015; 8. Nilsson M. ISMRM 2018. 9. Warrington S. NIMG 2020. 10. Fischl B. NIMG 2012. Funding: NIH K99AG080076 and R01NS095985.
Comments
Email is required but is not shown publicly.
Loading comments...