1,267 posters, 47 videos, 13 topics, 4 sessions, 853 authors
ePostersLive by SciGen Technologies S.A. All rights reserved.
SOHO 2026 Annual Meeting
September 9 - 12, 2026 | George R. Brown Convention Center, Houston, Texas

HL - 1084
Projections of Mortality rates in Hematologic Malignancies Among Older Adults: A Centers for Disease Control and Prevention WONDER Database Analysis Through 2035
Poster Presenter
Authors
Part of Topic
Hodgkin Lymphoma (HL)
|
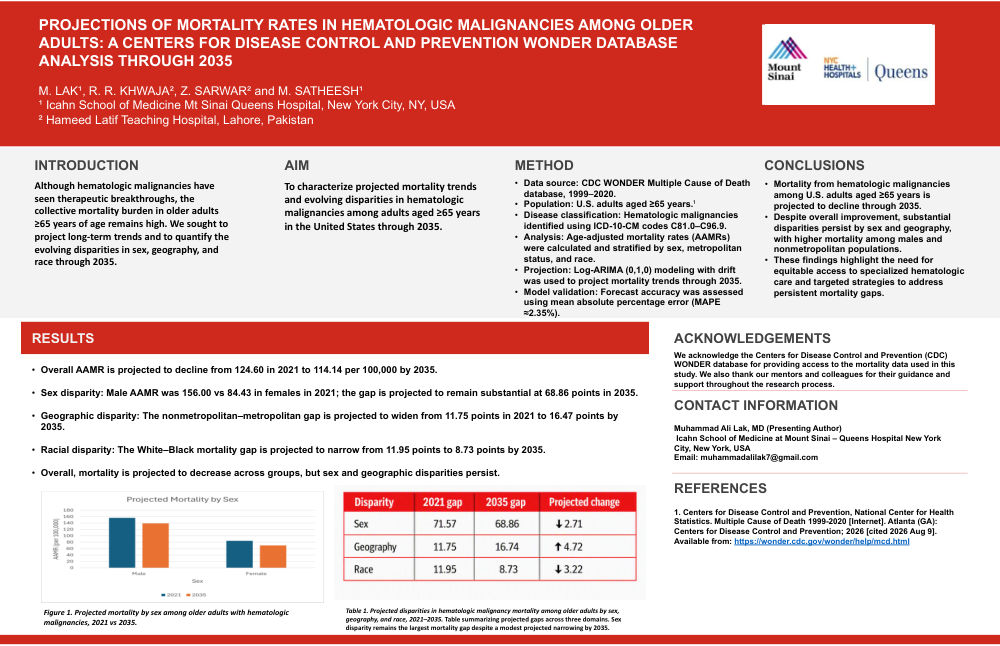
INTRODUCTION Although hematologic malignancies have seen therapeutic breakthroughs, the collective mortality burden in older adults ≥65 years of age remains high. We sought to project long-term trends and to quantify the evolving disparities in sex, geography, and race through 2035. AIM To characterize projected mortality trends and evolving disparities in hematologic malignancies among adults aged ≥65 years in the United States through 2035. METHOD CONCLUSIONS • Data source: CDC WONDER Multiple Cause of Death database, 1999–2020. • Population: U.S. adults aged ≥65 years.1 identified using ICD-10-CM codes C81.0–C96.9. • Analysis: Age-adjusted mortality rates (AAMRs) were calculated and stratified by sex, metropolitan status, and race. was used to project mortality trends through 2035. • Model validation: Forecast accuracy was assessed using mean absolute percentage error (MAPE ≈2.35%). • Mortality from hematologic malignancies among U.S. adults aged ≥65 years is projected to decline through 2035. • Despite overall improvement, substantial disparities persist by sex and geography, with higher mortality among males and nonmetropolitan populations. • These findings highlight the need for equitable access to specialized hematologic care and targeted strategies to address persistent mortality gaps. |
|
RESULTS
ACKNOWLEDGEMENTS We acknowledge the Centers for Disease Control and Prevention (CDC) WONDER database for providing access to the mortality data used in this study. We also thank our mentors and colleagues for their guidance and support throughout the research process. CONTACT INFORMATION Muhammad Ali Lak, MD (Presenting Author) City, New York, USA REFERENCES 1. Centers for Disease Control and Prevention, National Center for Health Statistics. Multiple Cause of Death 1999-2020 [Internet]. Atlanta (GA): Centers for Disease Control and Prevention; 2026 [cited 2026 Aug 9]. Available from: https://wonder.cdc.gov/wonder/help/mcd.html Figure 1. Projected mortality by sex among older adults with hematologic malignancies, 2021 vs 2035. Table 1. Projected disparities in hematologic malignancy mortality among older adults by sex, geography, and race, 2021–2035. Table summarizing projected gaps across three domains. Sex disparity remains the largest mortality gap despite a modest projected narrowing by 2035. |