1,267 posters, 47 videos, 13 topics, 4 sessions, 853 authors
ePostersLive by SciGen Technologies S.A. All rights reserved.
SOHO 2026 Annual Meeting
September 9 - 12, 2026 | George R. Brown Convention Center, Houston, Texas

MPN - 1082
Exposure-Response Analyses of Hemoglobin Changes During Epetraborole Administration to Nonhuman Primates Predict Human Exposure-Response Relationships
Poster Presenter
Authors
Part of Topic
Myeloproliferative Neoplasms (MPN)
INTRODUCTION:
Epetraborole (EBO) is a novel, boron-containing small molecule found to specifically decrease erythropoiesis in nonhuman primates (NHPs) [1]. This effect, limited to the erythroid cell line, suggests a potential role of EBO in treating polycythemia vera (PV) [1]. PV is a rare blood cancer in which there is an abnormal increase in red blood cells [2].
OBJECTIVES:
Develop an exposure-response model for the relationship between EBO free-drug area under the concentration-time curve (AUC) and maximal hemoglobin (Hgb) decrease. Evaluate the translatability of exposure-response relationships from NHPs to predict Hgb changes during EBO administration in humans.
METHODS:
Data:
Two toxicity studies in which NHPs were administered EBO once daily for at least 90 days (n=116). NHPs underwent intense pharmacokinetic (PK) sampling over the course of treatment and had hematology sampling prior to treatment, 4 times during treatment, and once during follow-up [3].
Human Phase 1 studies:
Exposure-Response Model:
Data from the NHP toxicity studies was used to construct a sigmoidal, Emax model correlating EBO PK exposure with maximum percent change from baseline in Hgb during treatment. PK exposure in each NHP was estimated using non-compartmental methods. Exposure-response models were fit to the data using R, statistical software.
Population PK Model Development and Simulations:
Data from Phase 1 studies was used to develop a population PK model to describe the PK of EBO in humans. The model was then qualified using observed EBO concentration-time data from Phase 2/3 participants. The population PK model was used to predict EBO PK exposure in a hypothetical population of patients (N=10,000, with characteristics resampled from Study EBO-301). Simulated exposures were then input into the exposure-response model to predict the maximum percent change from baseline in Hgb during treatment. Summary statistics of the percent change from baseline in Hgb were calculated using observed data from participants randomized to EBO in Study EBO-301.
RESULTS:
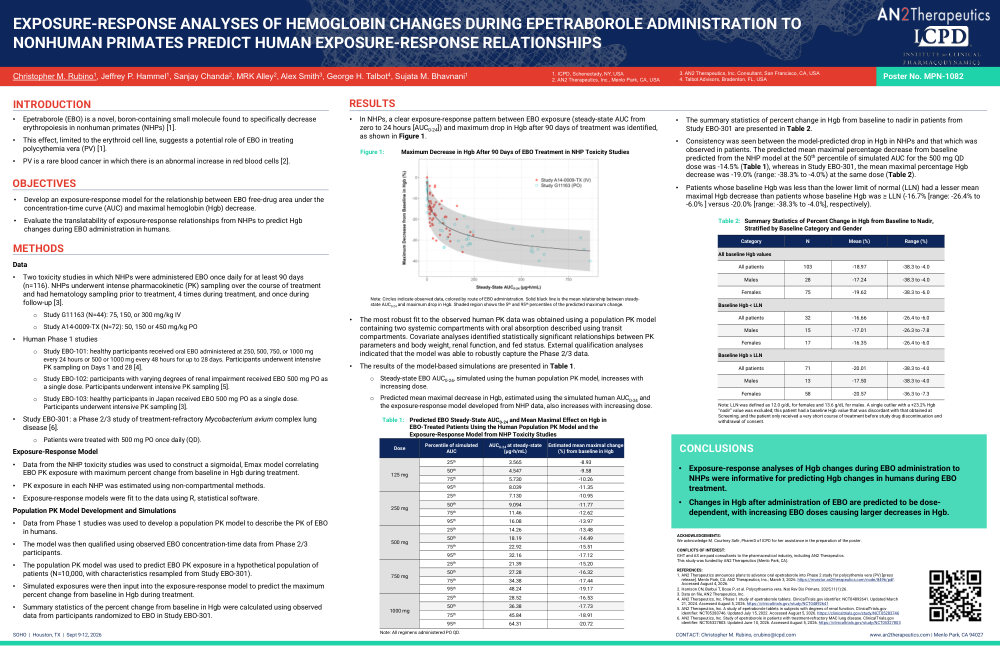
In NHPs, a clear exposure-response pattern between EBO exposure (steady-state AUC from zero to 24 hours [AUC0-24]) and maximum drop in Hgb after 90 days of treatment was identified, as shown in Figure 1.
The most robust fit to the observed human PK data was obtained using a population PK model containing two systemic compartments with oral absorption described using transit compartments. Covariate analyses identified statistically significant relationships between PK parameters and body weight, renal function, and fed status. External qualification analyses indicated that the model was able to robustly capture the Phase 2/3 data.
The results of the model-based simulations are presented in Table 1. Steady-state EBO AUC0-24, simulated using the human population PK model, increases with increasing dose. Predicted mean maximal decrease in Hgb, estimated using the simulated human AUC0-24 and the exposure-response model developed from NHP data, also increases with increasing dose.
The summary statistics of percent change in Hgb from baseline to nadir in patients from Study EBO-301 are presented in Table 2. Consistency was seen between the model-predicted drop in Hgb in NHPs and that which was observed in patients. The predicted mean maximal percentage decrease from baseline predicted from the NHP model at the 50th percentile of simulated AUC for the 500 mg QD dose was -14.5% (Table 1), whereas in Study EBO-301, the mean maximal percentage Hgb decrease was -19.0% (range: -38.3% to -4.0%) at the same dose (Table 2). Patients whose baseline Hgb was less than the lower limit of normal (LLN) had a lesser mean maximal Hgb decrease than patients whose baseline Hgb was ≥ LLN (-16.7% [range: -26.4% to -6.0% ] versus -20.0% [range: -38.3% to -4.0%], respectively).
CONCLUSIONS:
Exposure-response analyses of Hgb changes during EBO administration to NHPs were informative for predicting Hgb changes in humans during EBO treatment. Changes in Hgb after administration of EBO are predicted to be dose-dependent, with increasing EBO doses causing larger decreases in Hgb.